


公式サプライヤー
公式および認定ディストリビューターとして200社以上の開発元から正規ライセンスを直接ご提供いたします。
当社のすべてのブランドをご覧ください。
DevExpress WPF is a powerful suite of controls that enhances your WPF development toolkit. It offers data grids, ribbon menus, rich text editors, spreadsheets, charts, and more – all with beautiful themes and touch-friendly interfaces. DevExpress WPF empowers you to build professional-looking, responsive applications that meet modern user expectations, saving you time and effort while adding polish and functionality.
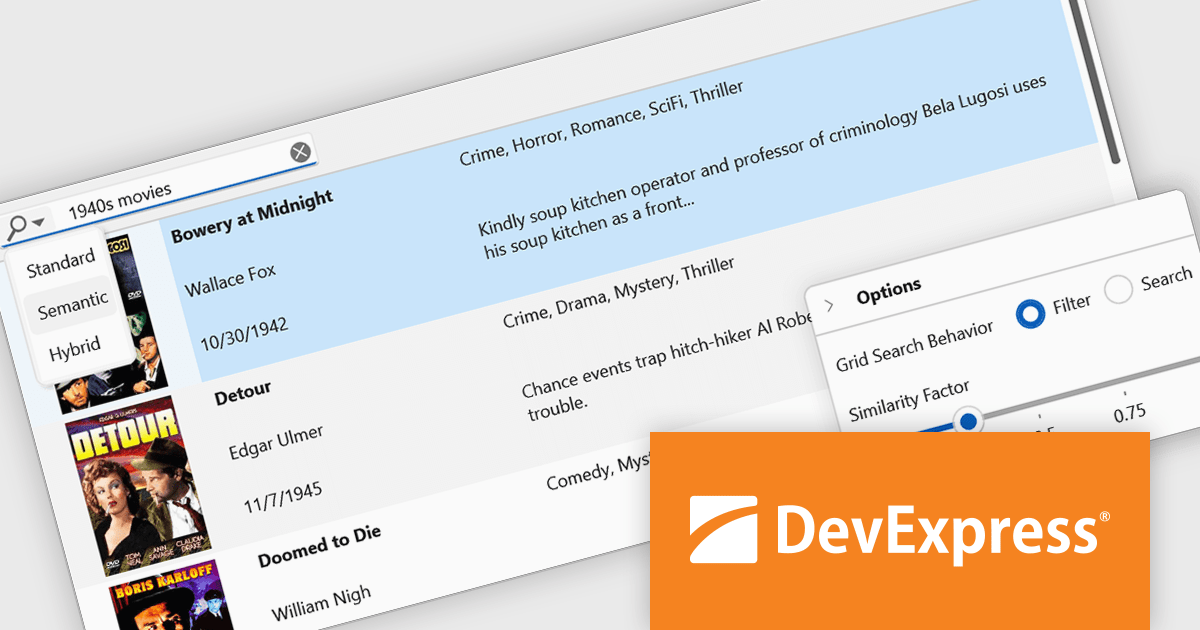
The DevExpress WPF v25.1 update introduces a new semantic search capability for the Data Grid that leverages Natural Language Processing (NLP). Rather than depending solely on exact keyword matches, it converts user input into vector representations. These representations are then analyzed through a similarity algorithm, allowing the system to identify and rank results based on contextual meaning. This update significantly improves the quality of search results, especially in datasets where users may phrase queries in varied or imprecise ways. It’s particularly beneficial in applications that deal with complex or user-generated content, offering developers a more natural and adaptive search mechanism.
To see a full list of what's new in version 25.1, see our release notes.
DevExpress WPF is licensed per developer and is available as a Perpetual License with a 12 month support and maintenance subscription. We can supply new subscriptions, subscription renewals, and additional licenses. See our DevExpress WPF licensing page for full details.
DevExpress WPF is available to buy in the following products:
ActiveReports.NET from MESCIUS, is a comprehensive reporting solution for developers building applications in .NET. It empowers you to design and deliver visually appealing reports through user-friendly designers and a wide range of controls. ActiveReports simplifies report creation and distribution with a versatile API, rich data source connectivity, and support for multiple export formats. This translates to increased developer productivity and improved end-user experience with powerful reporting functionalities within your .NET applications.
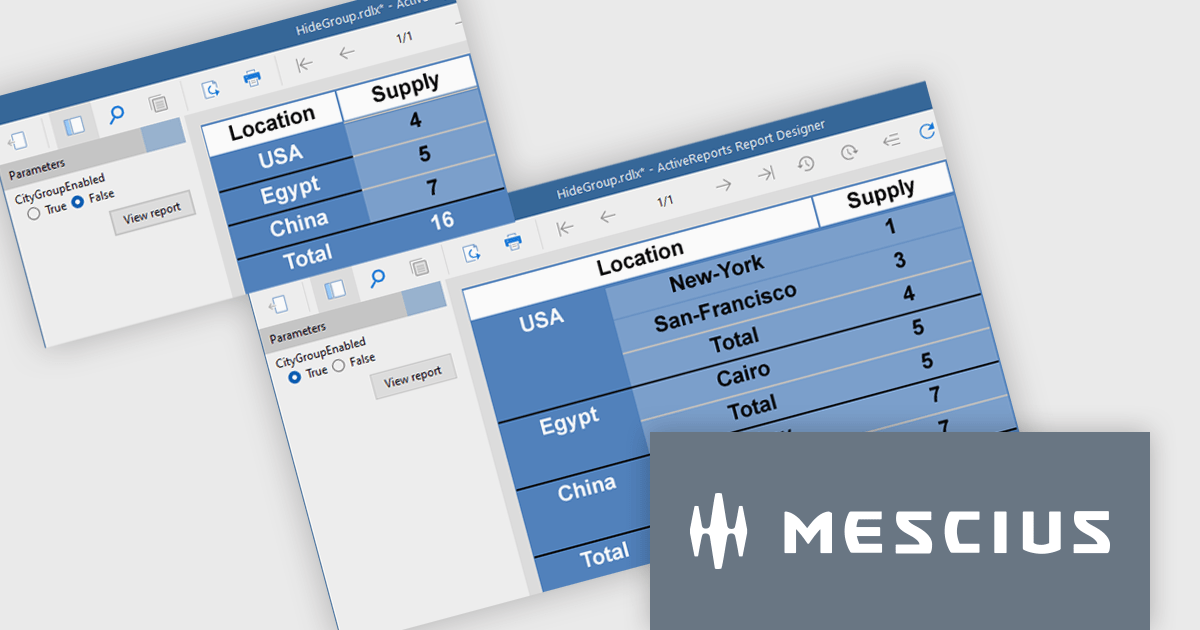
The ActiveReports v19.1 update introduces enhanced grouping control that allows developers to enable or hide groups in Tables, BandedLists, and Tablix controls based on expressions or parameters. This capability makes it easier to design reports that adapt at runtime to different data scenarios or user inputs, without requiring code changes. By configuring the new "Enabled" and "Hidden" properties directly within the report definition, developers can deliver more flexible and maintainable reporting solutions that respond dynamically to business logic.
To see a full list of what's new in v19.1, see our release notes.
ActiveReports.NET is licensed per developer and is available with or without a 12 month support and maintenance subscription. See our ActiveReports.NET licensing page for full details.
Learn more on our ActiveReports.NET product page.
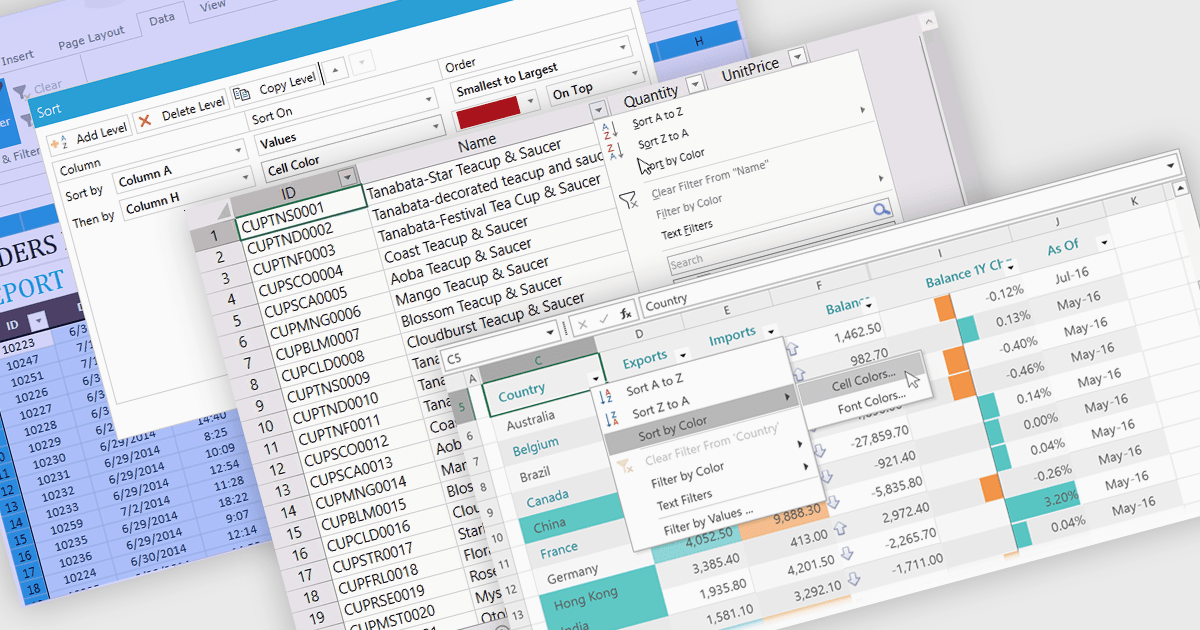
Data sorting in a spreadsheet control is a fundamental feature that enables users to rearrange data within a grid or table based on specific criteria, typically ascending or descending alphabetically or by numerical value. Sorting will usually be performed on single or multiple columns and is often integrated with other data manipulation tools like filtering, grouping, and searching. By sorting data, users can quickly locate and analyze information, identify patterns, and ensure consistency across records. Especially useful in large datasets, it improves the readability of the information and makes it more organized in preparation for decision-making, reporting, and data validation. This capability facilitates efficient data analysis, and supports better user interaction by allowing datasets to be viewed in meaningful sequences.
Several WPF spreadsheet controls offer support for data sorting including:
For an in-depth analysis of features and price, visit our WPF spreadsheet controls comparison.
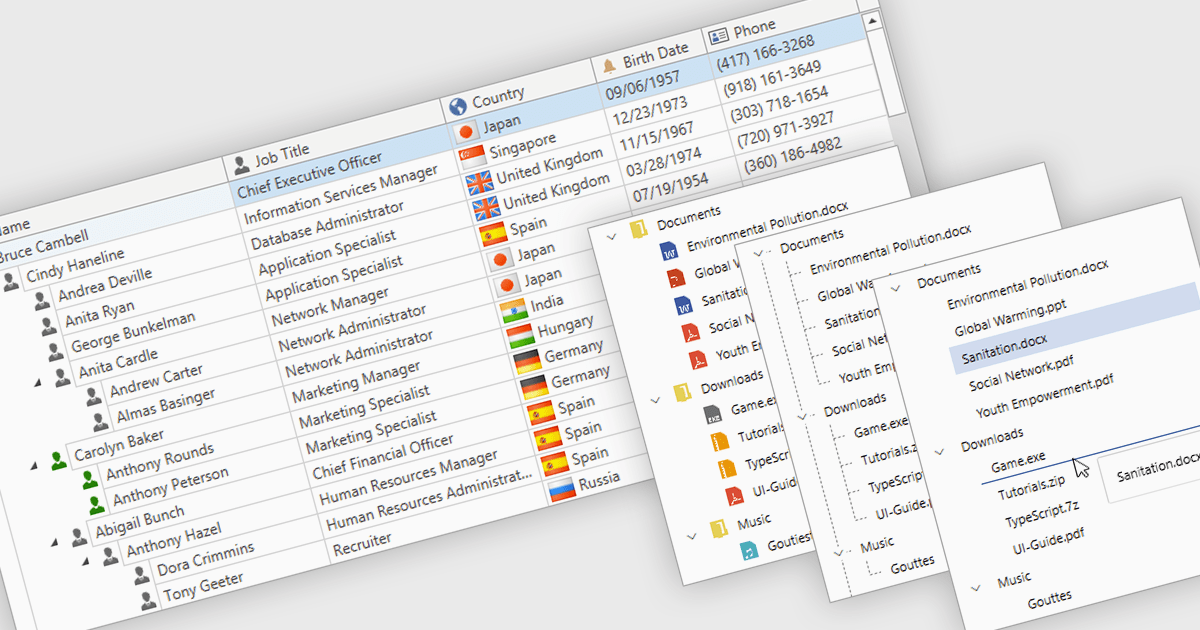
Tree lists, commonly included in professional UI component suites, are advanced controls designed to display hierarchical data in a structured and expandable format. They present parent-child relationships clearly, allowing users to navigate through multiple levels of data with ease. With features such as collapsible nodes, dynamic data loading, and customizable templates, tree lists improve both performance and user experience, particularly when working with large or complex datasets. In user interface development, they are frequently used for file explorers, category navigation, permission settings, project management views, and organizational charts. By integrating tree lists, developers can provide a more intuitive, scalable, and interactive way to manage structured information.
Several WPF UI suites offer tree list components including:
For an in-depth analysis of features and price, visit our WPF UI suites comparison.
Telerik Reporting and Telerik Report Server deliver a complete solution for creating, managing, and distributing reports across .NET applications. Telerik Reporting is a lightweight, embedded reporting tool for .NET web and desktop apps. It lets developers and users easily design, customize, and export interactive, reusable reports. It supports multiple platforms, including ASP.NET Core, Blazor, MVC, AJAX, HTML5/JS, Angular, WPF, WinForms, and WinUI. Telerik Report Server is a web-based, server-side solution for centralized report management. Built on Telerik Reporting, it offers scheduling, delivery, user management, and web-based access. It can be used standalone or integrated into apps built with Blazor, Angular, or Windows Forms.
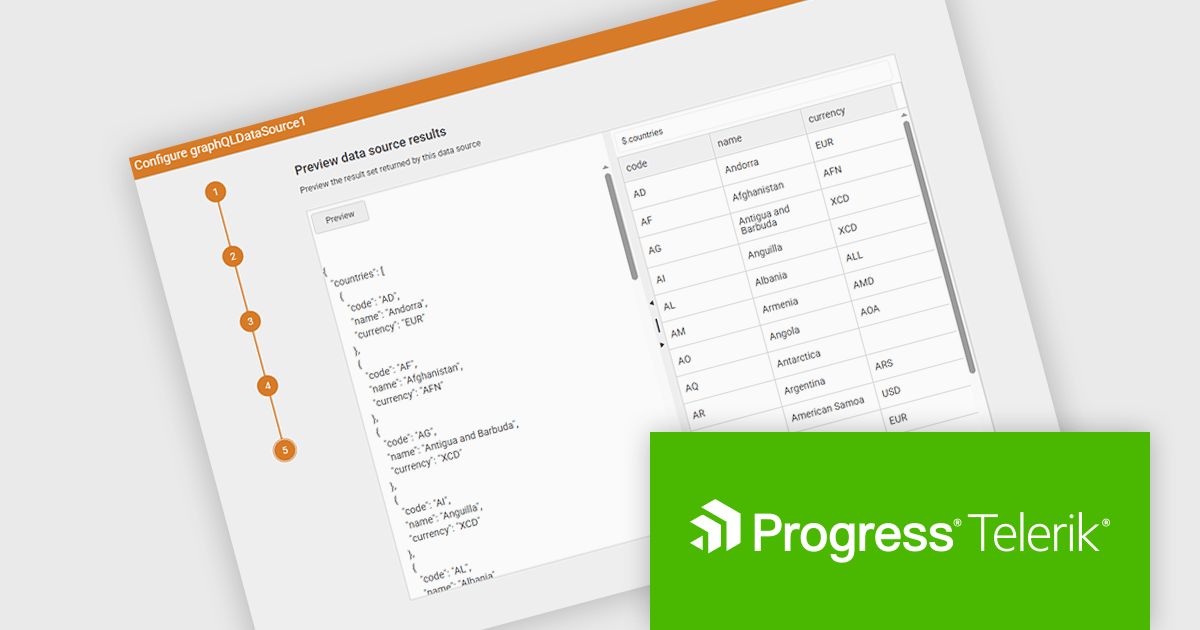
The Telerik Reporting and Telerik Report Server 2025 Q2 update introduces a new GraphQL DataSource Wizard in the Web Report Designer that simplifies the process of connecting to GraphQL APIs. This enhancement improves data integration by guiding developers through a clear, step-by-step configuration process, eliminating the need for manual setup or in-depth knowledge of GraphQL syntax. It enables faster data connectivity and report creation directly within the browser-based design environment, improving overall efficiency and reducing development time when working with GraphQL data sources.
To see a full list of what's new, see our release notes for Telerik Reporting and Telerik Report Server 2025 Q2.
Telerik Reporting is licensed per developer and has two licensing models: an annual Subscription License and a Perpetual License. The Subscription license must be renewed to continue using the software. The Perpetual license is a one-time purchase granting access to the current released version and includes a one-year subscription for product updates and technical support. Telerik Report Server is available as a perpetual license and is licensed per domain. Each domain license contains 15 Client Access Licenses and 1 year support and maintenance. See our licensing pages for Telerik Reporting and Telerik Report Server for full details.
Telerik Reporting and Telerik Report Server are available individually or as part of Telerik DevCraft Ultimate.
電話: (888) 850 9911
Fax: +1 770 250 6199


