


公式サプライヤー
公式および認定ディストリビューターとして200社以上の開発元から正規ライセンスを直接ご提供いたします。
当社のすべてのブランドをご覧ください。
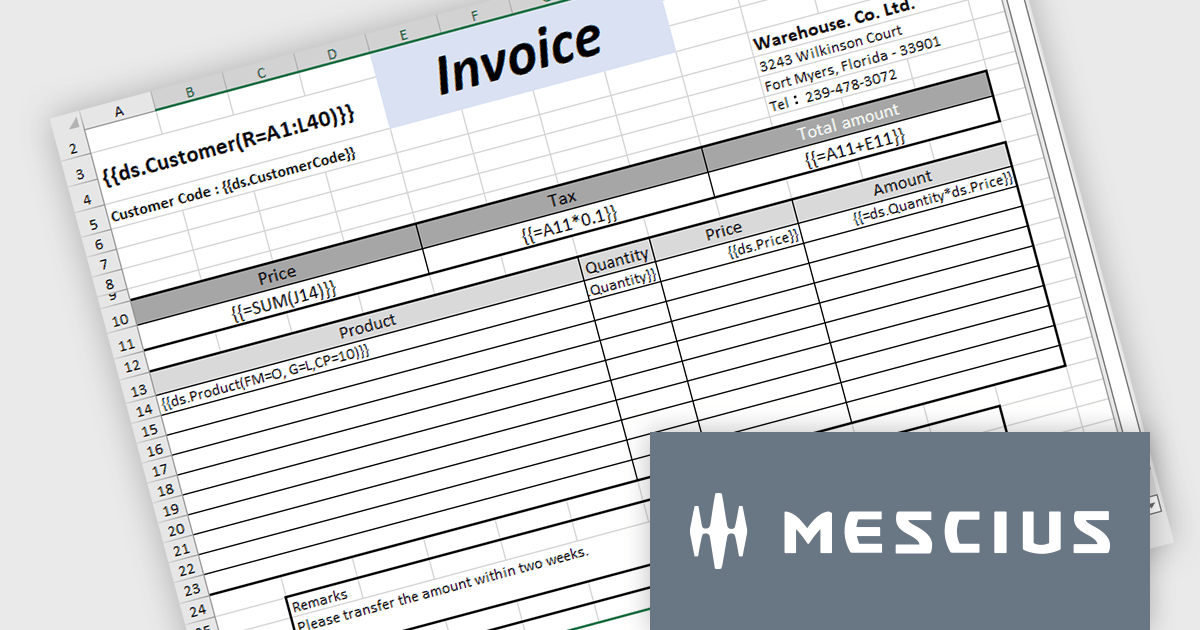
Document Solutions for Excel, .NET Edition (DsExcel) is a high-performance spreadsheet API library that enables .NET developers to create, manipulate, and generate Excel documents within their applications entirely independent of Microsoft Excel. DsExcel boasts a fast and lightweight design and features cross-platform and cross-framework compatibility. It includes a powerful calculation engine that handles over 450 Excel functions and allows for the creation of custom functions for complex calculations.
The Document Solutions for Excel v7.1 update includes enhancements to DsExcel templates which prioritize performance and stability to cater to a broader range of use cases. This includes improved handling of missing data sources, new OverwriteFillFormat functionality to operate in both Pagination and non-Pagination modes, expanded support for image and shape elements, optimized processing for merged cells, and backwards compatibility with older templates to ensure a smooth transition for existing users.
To see a full list of what's new in v7.1.0, see our release notes.
Document Solutions for Excel, .NET Edition is licensed per developer and is available in several license options for differing distribution needs. Team licenses are also available for multiple developers within the same organization. See our Document Solutions for Excel, .NET Edition licensing page for full details.
Learn more on our Document Solutions for Excel, .NET Edition product page.
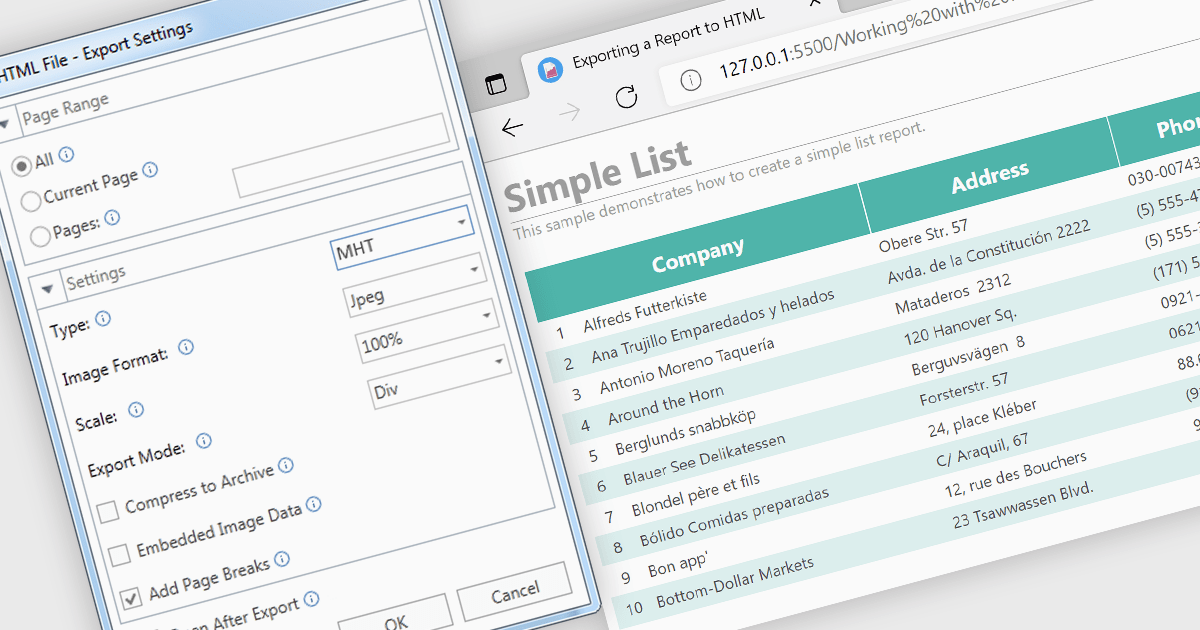
MHT (MHTML or MIME HTML) is a web archive format that bundles a web page's HTML code and all its resources such as images, stylesheets, and scripts into a single file that can be viewed offline or in applications that don't require an internet connection. Exporting to MHT format gives you a single archive file that contains your webpage and all its necessary components. This format is especially beneficial for preserving the exact state of a web page at a specific point in time, allowing for offline storage and easy sharing without losing the original design and functionality. Additionally, it simplifies the management and transfer of web content by consolidating multiple files into a single entity.
Several .NET 8 WPF reporting components allow you to export to MHT, including:
For an in-depth analysis of features and price, visit our comparison of .NET 8 WPF reporting components.
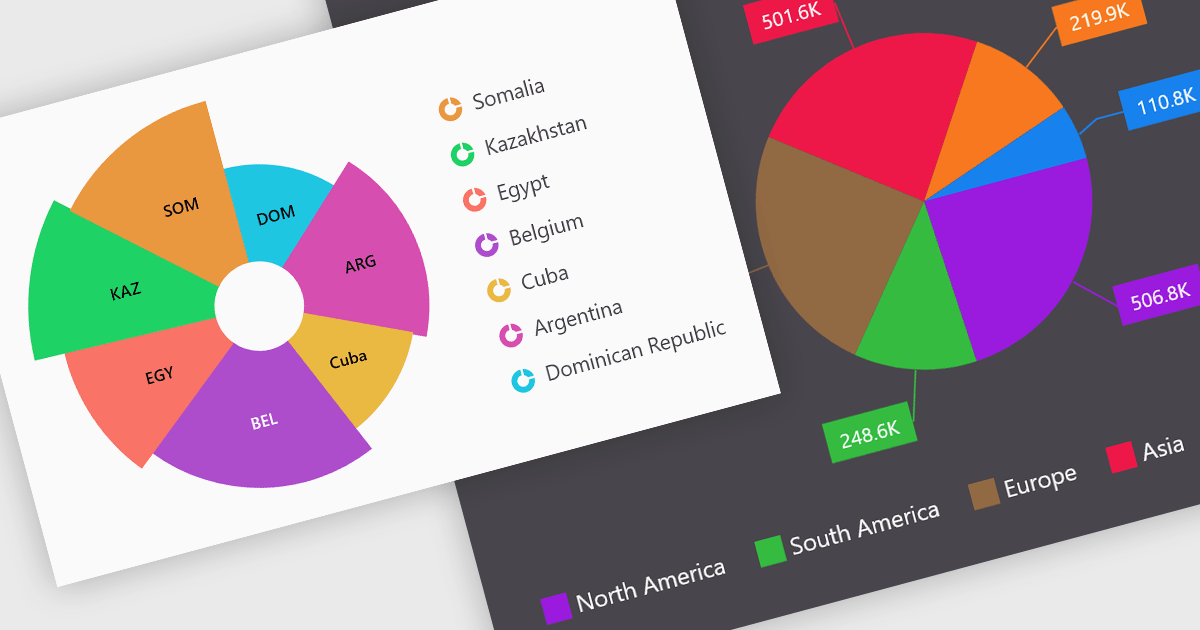
Pie charts are a useful and easily understood tool for visualizing data breakdowns at a glance, particularly when representing percentages of a whole. Their strength lies in highlighting the relative proportions between a small number of categories within a dataset. While less effective for complex comparisons or trends over time, pie charts can be an effective choice to communicate compositions and dominance within a dataset.
Several Blazor Chart controls offer Pie charts including:
For an in-depth analysis of features and price, visit our Blazor Chart controls comparison.
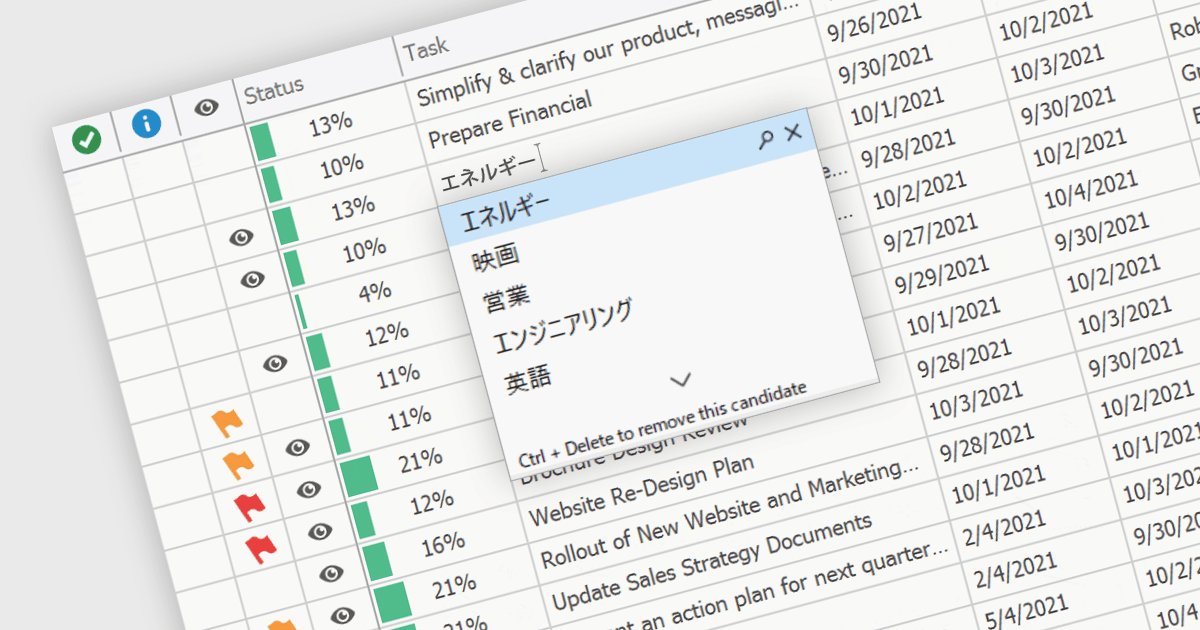
An Input Method Editor (IME) facilitates the entry of complex characters and scripts not directly supported by standard keyboards, which is especially vital for languages with extensive character sets like Chinese, Japanese, and Korean. When integrated into a grid component, an IME enables users to input text directly into data cells using phonetic or syllabic methods that are converted into the desired characters. This integration streamlines the data entry process in applications requiring multi-language support, significantly enhancing usability and efficiency. It simplifies the development of applications targeting global markets by providing native language input support, thereby improving the user experience and reducing the need for external language input tools.
Several WinForms grid components offer Input Method Editor (IME) support, including:
For an in-depth analysis of features and price, visit our comparison of WinForms grid components.
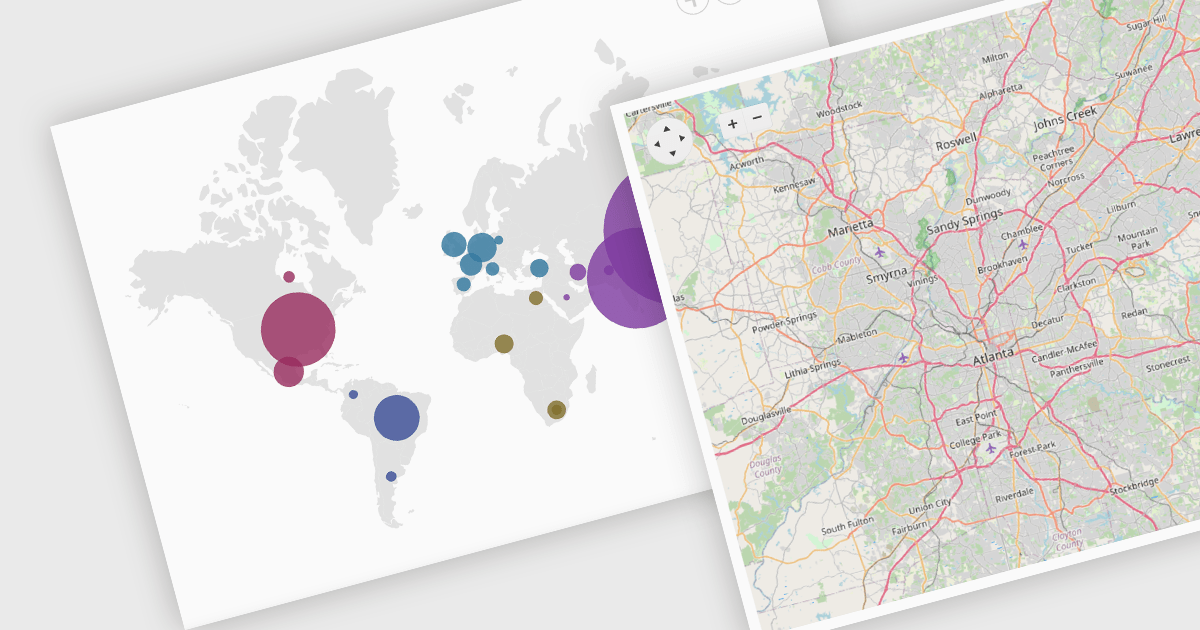
Map component extend your Blazor app's functionality by facilitating the display of geographic information. This allows you to visualize data with real-world location context, enhancing user understanding and engagement. Blazor map components often integrate with popular map providers and support features such as markers, layers, and customization, allowing you to create interactive and informative map experiences within your web application.
Several Blazor UI suites feature map components including:
For an in-depth analysis of features and price, visit our Blazor UI Suites comparison.
電話: (888) 850 9911
Fax: +1 770 250 6199


