


公式サプライヤー
公式および認定ディストリビューターとして200社以上の開発元から正規ライセンスを直接ご提供いたします。
当社のすべてのブランドをご覧ください。
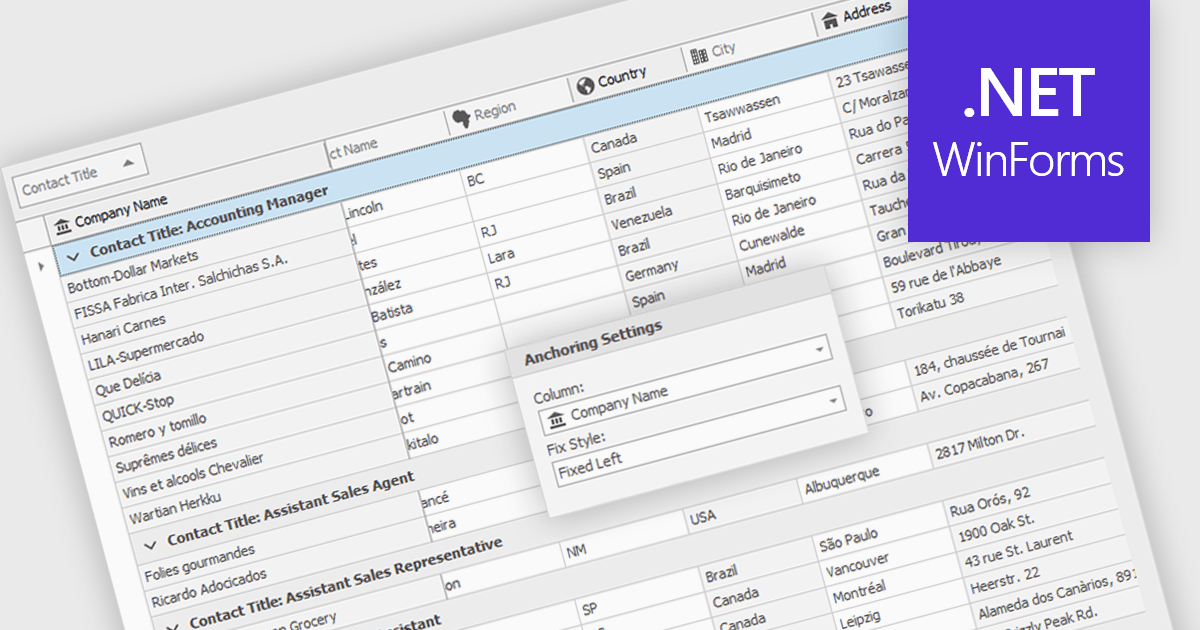
Freezing columns allows specific grid columns to remain visible on the screen while the user scrolls horizontally across the rest of the data. This functionality is beneficial for software developers because it improves user experience by ensuring important reference information, like row identifiers or column headers, stays constantly in view regardless of the data set's width. This can significantly aid in data comprehension and navigation for users working with large datasets.
Several WinForms grid components allow you to freeze columns, including:
For an in-depth analysis of features and price, visit our WinForms grid components comparison.
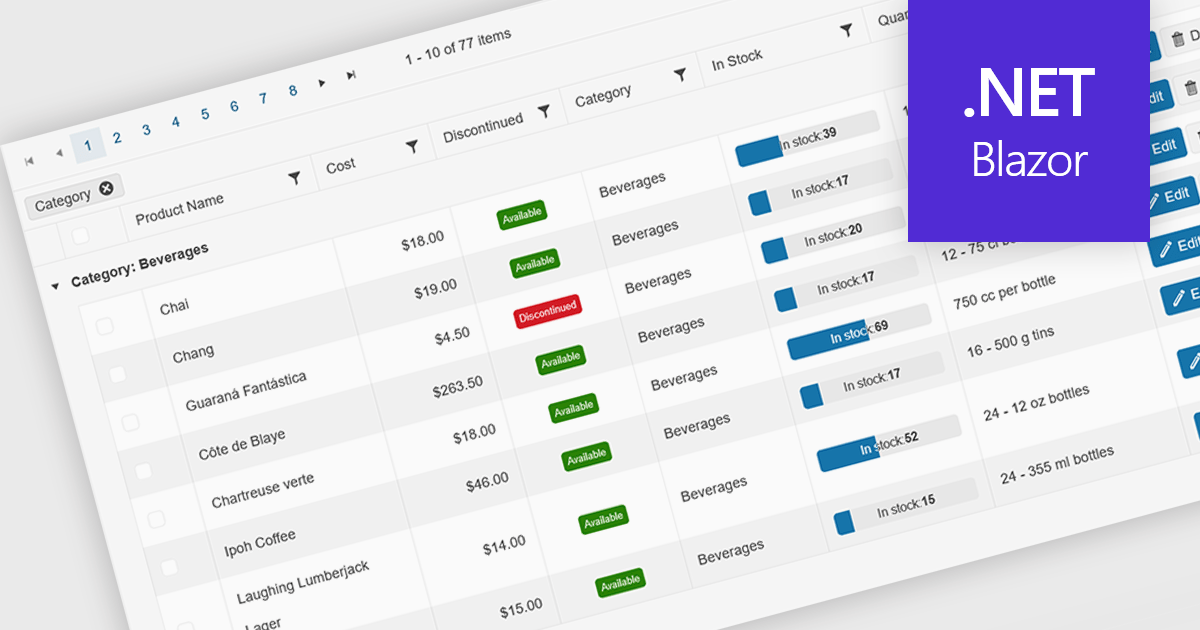
Grid paging is a user interface technique that divides large datasets into smaller, manageable pages within a grid or table. This significantly enhances performance by reducing the amount of data processed and displayed at once, improving load times and responsiveness, particularly when dealing with extensive datasets. Paging also enhances user experience by providing a clear structure for navigating through information, helping to prevent the user from being overwhelmed with excessive data.
Several Blazor grid controls offer paging support including:
For an in-depth analysis of features and price, visit our Blazor grid controls comparison.
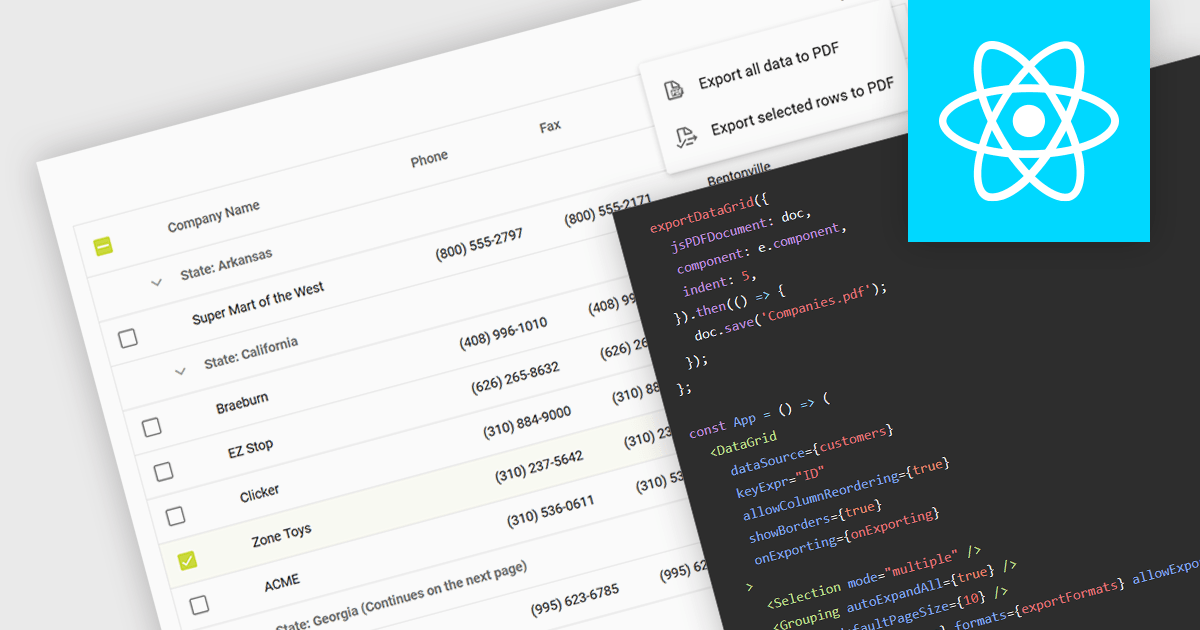
Exporting a data grid to PDF captures the grid layout, including columns, rows, and formatting, and transforms it into a universally accessible and easily shareable document. The export creates a static file, retaining the original grid layout and formatting, that can be easily distributed and viewed consistently across different platforms and on any device with a PDF reader. Additionally, PDFs provide a secure format for preserving data integrity and can be protected against unauthorized editing, making them ideal for official documentation and archiving purposes. This functionality enhances collaboration and data dissemination efficiency by simplifying the sharing and printing processes while maintaining the original data structure and presentation.
Several React grid components allow you to export to PDF, including:
For an in-depth analysis of features and price, visit our comparison of React grid components.
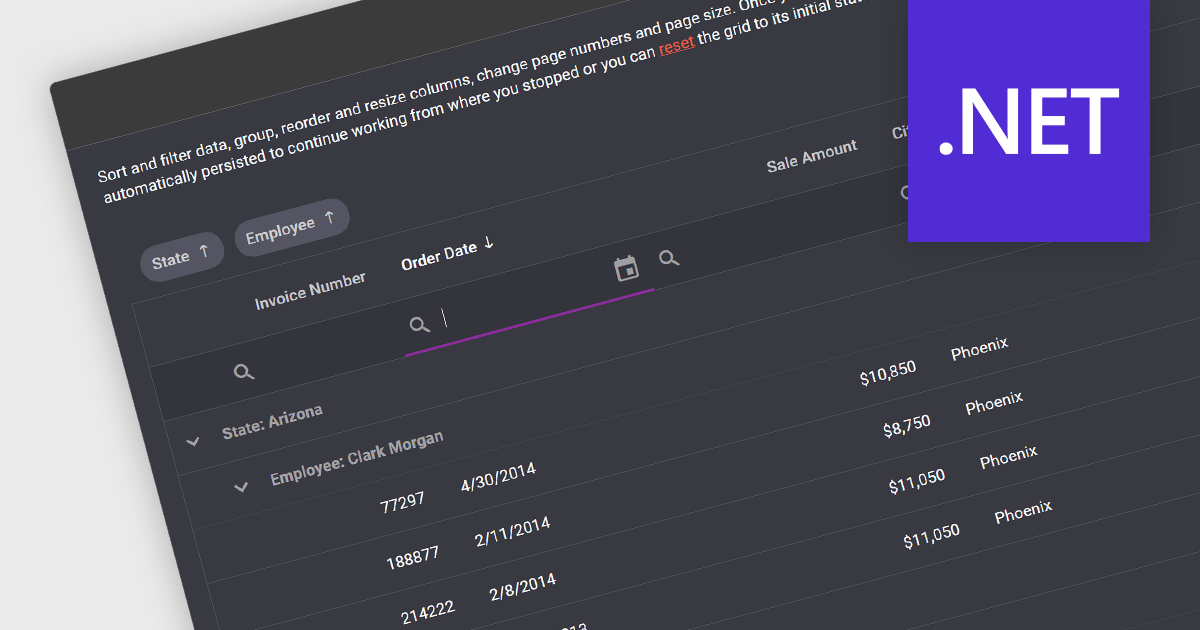
In .NET development, a grid control with state persistence empowers applications with datagrid functionality while enabling users to personalize their experience. These components remember user-applied settings like sorting, filtering, and column resizing, automatically restoring them upon subsequent grid loads. This continuity eliminates the need for repeated configuration, boosting productivity and user satisfaction, especially in data-intensive applications where users frequently interact with complex datasets.
Several .NET grid components support state persistence, including:
For an in-depth analysis of features and price, visit our comparison of .NET grid components.

A pivot grid is a data visualization tool that allows users to interactively explore and summarize multidimensional data. By dragging and dropping fields between rows, columns, and filters, developers can empower users to dynamically create custom views of their data, facilitating data analysis and informed decision-making without writing complex queries.
Several React UI suites feature a pivot grid control including:
For an in-depth analysis of features and price, visit our React UI Suites comparison.
電話: (888) 850 9911
Fax: +1 770 250 6199


