


公式サプライヤー
公式および認定ディストリビューターとして200社以上の開発元から正規ライセンスを直接ご提供いたします。
当社のすべてのブランドをご覧ください。
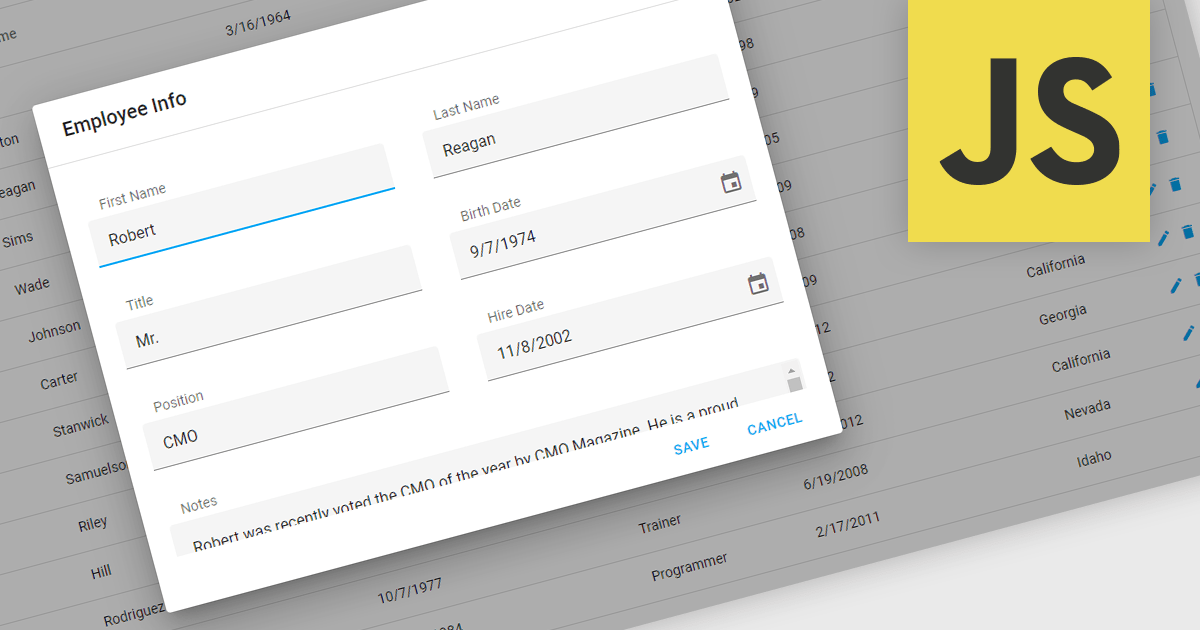
Popup Editors are a common user interface paradigm for editing data within JavaScript grid components. They provide a modal window that appears on top of the grid, containing dedicated input fields for modifying a specific cell or row. This approach enhances data manipulation by offering a focused editing environment with ample space for complex editors or detailed information, improving usability and reducing the risk of errors during data entry.
Many JavaScript grid controls offer popup editors including:
For an in-depth analysis of features and price, visit our comparison of JavaScript Grid Controls.
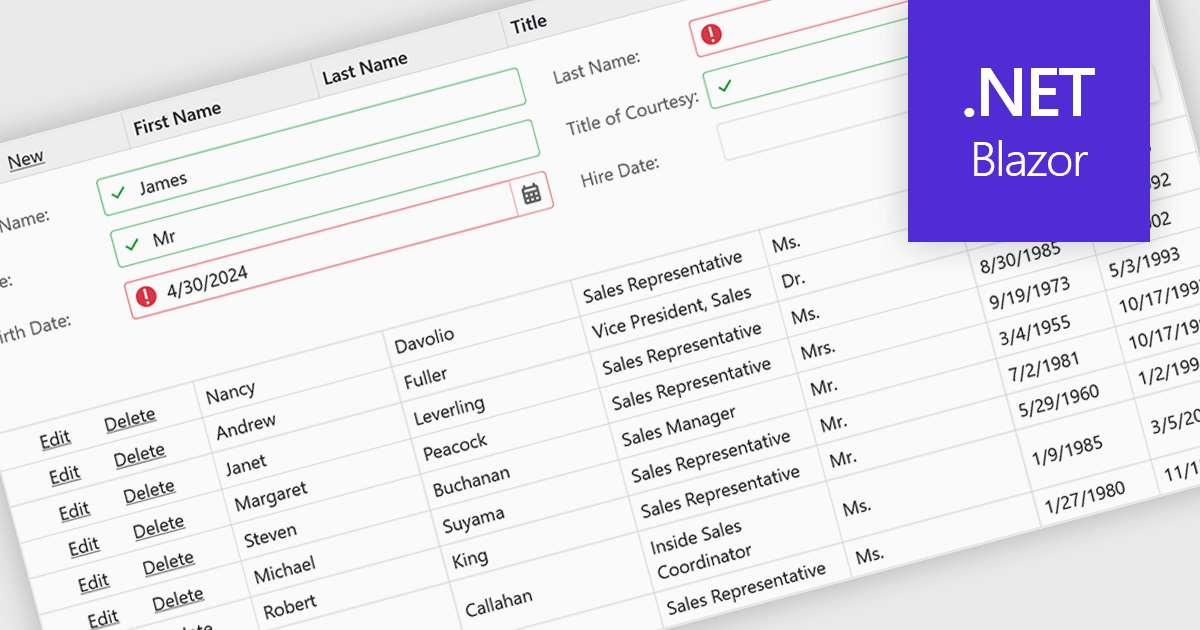
Data validation ensures the accuracy and integrity of information entered by users. It involves implementing rules to verify data against specific criteria, such as data type, format, or range. This helps prevent errors during data entry, improves data consistency, and safeguards against invalid information skewing analysis or downstream processes. Data validation is crucial in various scenarios, including managing financial records, maintaining customer databases, and ensuring data quality for scientific research.
Several Blazor grid controls offer data validation support including:
For an in-depth analysis of features and price, visit our Blazor Grid controls comparison.
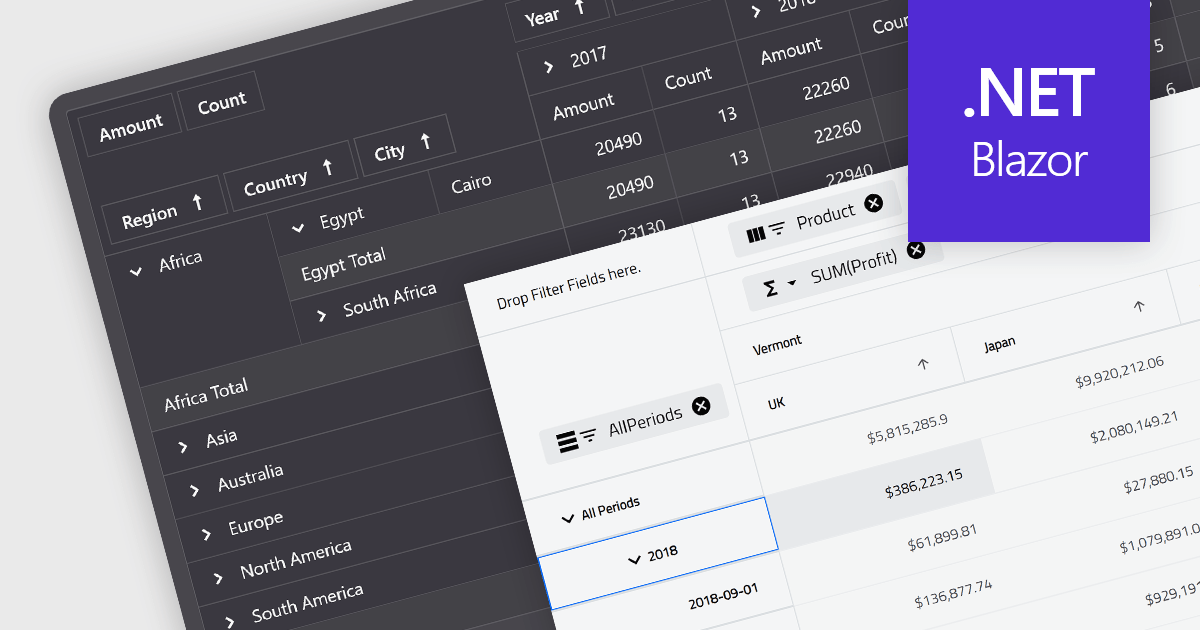
A pivot grid is a powerful data analysis tool that allows you to dynamically summarize and reorganize large datasets. By dragging and dropping fields, you can quickly create a new table that groups and calculates values based on different categories, revealing trends and patterns within your data. This interactive functionality makes pivot grids ideal for gaining insights and informing data-driven decisions. Common use cases include financial analysis, marketing campaign evaluation, and sales performance exploration.
Several Blazor UI suites feature a pivot grid control including:
For an in-depth analysis of features and price, visit our Blazor UI suites comparison.
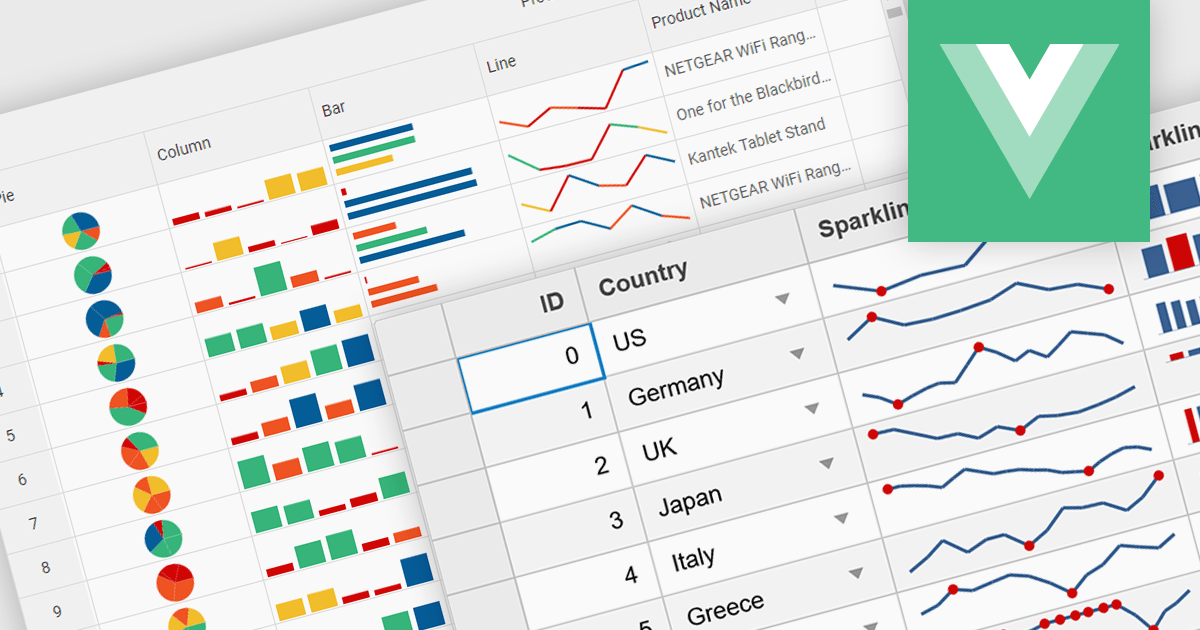
Sparklines are miniature charts embedded directly within grid cells, providing a quick visual summary of data trends within a larger dataset. These tiny line graphs, often lacking axes or detailed labels, condense information into a highly space-efficient format, allowing viewers to grasp patterns and fluctuations at a glance across multiple rows and columns of a grid.
Several Vue.js grid controls offer support for sparklines including:
For an in-depth analysis of features and price, visit our Vue.js Grid controls comparison.
ComponentOne Studio WinForms is a comprehensive development toolkit that empowers you to build feature-rich Windows Forms applications with ease. It equips you with over 120 UI controls spanning data presentation, input elements, and application layout. ComponentOne boasts extensive customization options, seamless Visual Studio integration, and support for the latest .NET versions, making it a valuable asset for streamlining WinForms development.
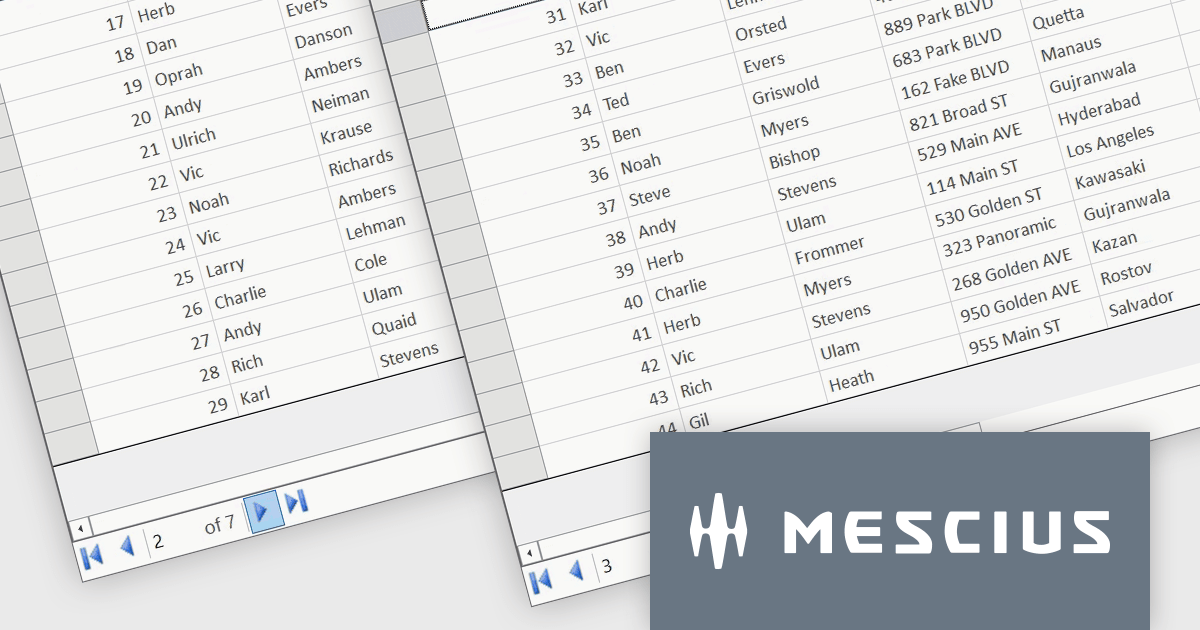
In this blog post, MESCIUS Software Engineer Kartik Dua demonstrates how paging can be implemented in the FlexGrid Datagrid control to provide an intuitive way to interact with large sets of data. Steps include:
A demo project to implement the paging functionality is available for download, as well.
Read the full blog to get started working with large datasets quickly and efficiently.
ComponentOne Studio WinForms is licensed per Developer on a perpetual basis and includes a 12 month subscription. Priority Support is also available. See our ComponentOne Studio WinForms licensing page for full details.
ComponentOne FlexGrid for WinForms is available to buy in the following products:
電話: (888) 850 9911
Fax: +1 770 250 6199


