


公式サプライヤー
公式および認定ディストリビューターとして200社以上の開発元から正規ライセンスを直接ご提供いたします。
当社のすべてのブランドをご覧ください。
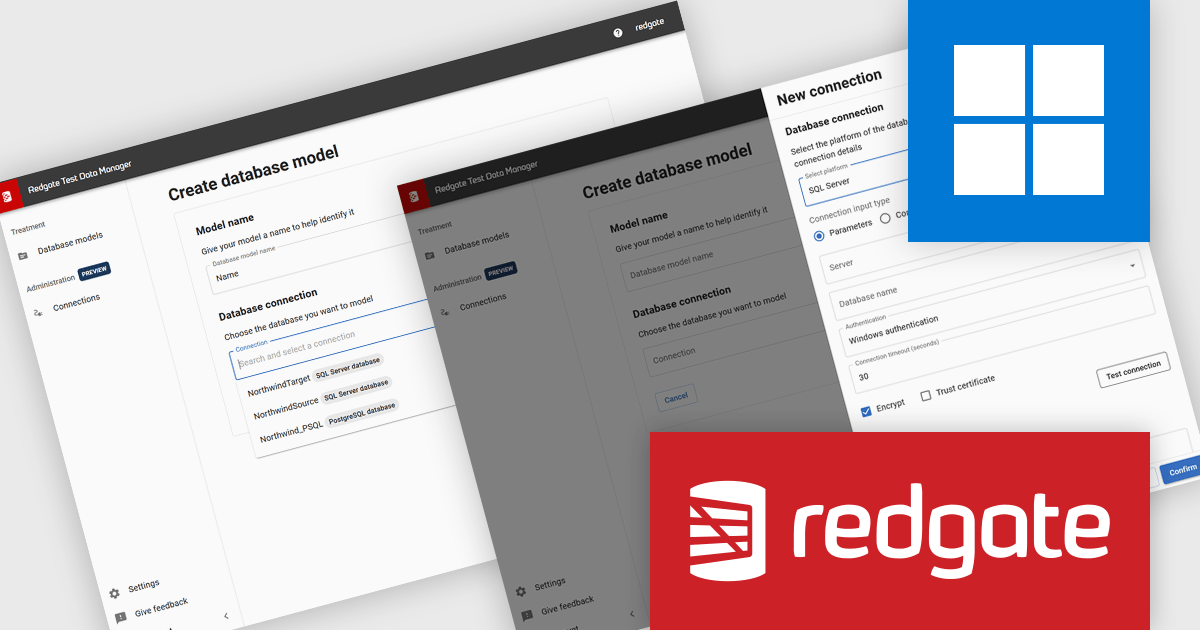
Redgate Test Data Manager is a comprehensive software solution designed to automate test data management within database environments. It enables teams to provision realistic, production-like data while masking sensitive information to maintain compliance with data privacy regulations such as GDPR and CCPA. With data masking, synthetic data generation, and efficient provisioning, it creates reliable test environments that mirror real-world scenarios.
Redgate Test Data Manager introduces a new feature that simplifies how you configure and reuse database connections across masking and subsetting jobs. By allowing you to define connection details once, assign them a recognizable name, and then select them from a dropdown, it reduces repetitive setup, minimizes configuration errors, and ensures consistent connection settings across environments. This enables development and QA teams to move more quickly from setup to executing test data workflows, keeping the focus on defining effective masking and subsetting rules rather than re-entering connection information.
Redgate Test Data Manager is licensed on a capacity model based on the total volume of data in all production databases (priced per TB). You will need to purchase enough licenses to cover the total TB across all your databases and technologies (SQL Server, Oracle, Postgres SQL and MySQL). See our Redgate Test Data Manager licensing page for full details.
For more information, visit our Redgate Test Data Manager product page.
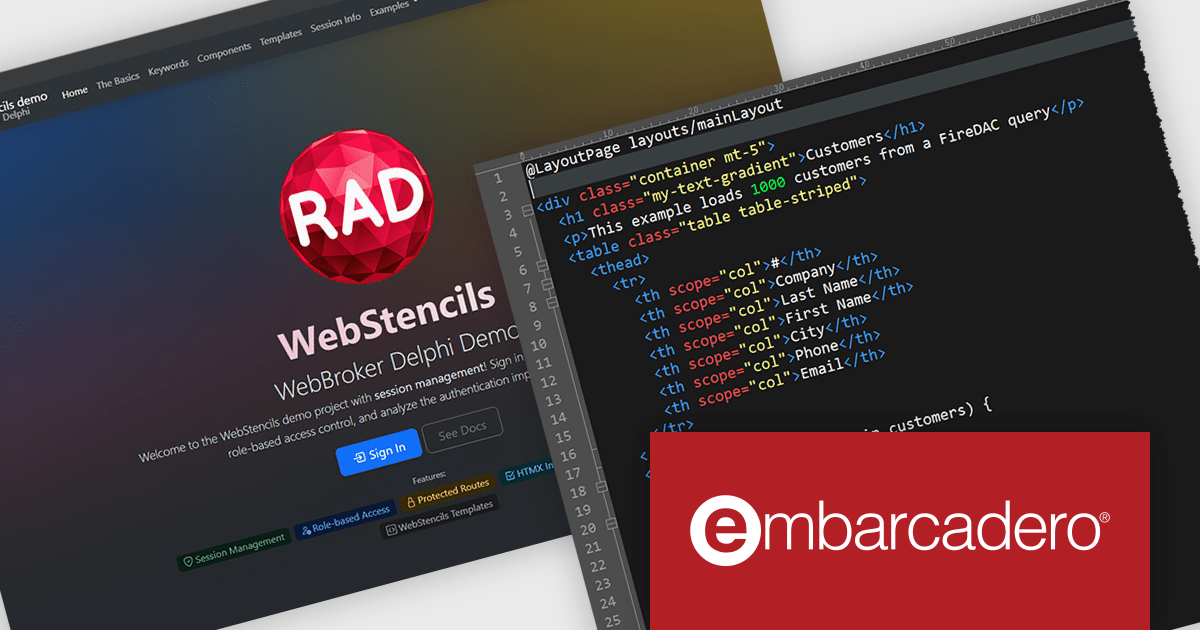
RAD Studio by Embarcadero is a integrated development environment (IDE) used to build applications for various platforms. It allows programmers to create native apps for Windows, macOS, mobile devices (Android and iOS), and more using C++ or Delphi. RAD Studio is known for its rapid application development features and is targeted towards professional developers building data-rich and visually appealing applications.
RAD Studio WebStencils introduces a rapid way to develop dynamic, database-driven web applications using minimal syntax and no dependency on heavy JavaScript frameworks. By integrating with HTMX (A lightweight open-source library that extends HTML to enable interactivity without complex JavaScript), WebStencils enables responsive, interactive pages through simple HTML attributes, removing the complexity of traditional frontend frameworks. Developers can build sophisticated applications using standard HTML and CSS, while backend developers leverage FireDAC datasets for data operations.
A key strength lies in its automatic form generation from database schemas. Developers can change a field or data type in the database and immediately see the reflected change in the browser - no manual adjustments needed. This drastically reduces the effort in maintaining CRUD (Create, Read, Update, Delete) interfaces.
RAD Studio is licensed per Named, Network Named or Concurrent user and is available as a Perpetual License with an Update Subscription that includes support and free upgrades for 1 Year. See our RAD Studio licensing page for full details.
RAD Studio is available to buy in the following products:
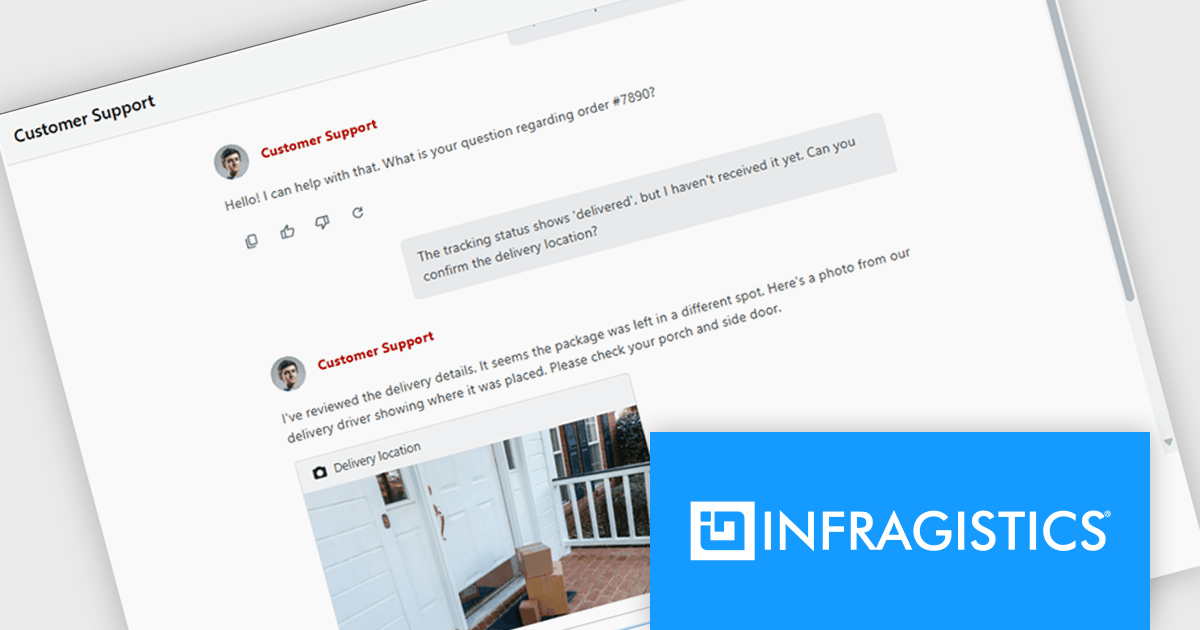
Infragistics Professional is a comprehensive suite of UI components designed to accelerate the development of high-performance, visually rich applications across several platforms. It provides developers with a vast collection of tools for building data-driven interfaces, including advanced grids, charts, and reporting features for web, desktop, and mobile environments.
The Infragistics Professional 25.2 release introduces an AI Chat control for React and Web Components. It provides a solid foundation for building responsive, real-time conversational interfaces in your applications. Whether you're creating a customer support tool, a collaborative chat workspace, or an AI assistant, this component includes essential features such as text messaging, file attachments, quick reply suggestions, and typing indicators. Unlike static message lists, it manages input, interaction, and rendering dynamically, ensuring a smooth user experience. The component also offers a robust rendering API that allows full customization of layout and visual elements, giving you control over how your chat interface looks and behaves.
To see a full list of what's new in version 25.2, see our release notes.
Infragistics Professional is licensed per developer and is available as a Perpetual License with a 1, 2 or 3 year support and maintenance subscription. See our Infragistics Professional licensing page for full details.
For more information, visit our Infragistics Professional product page.
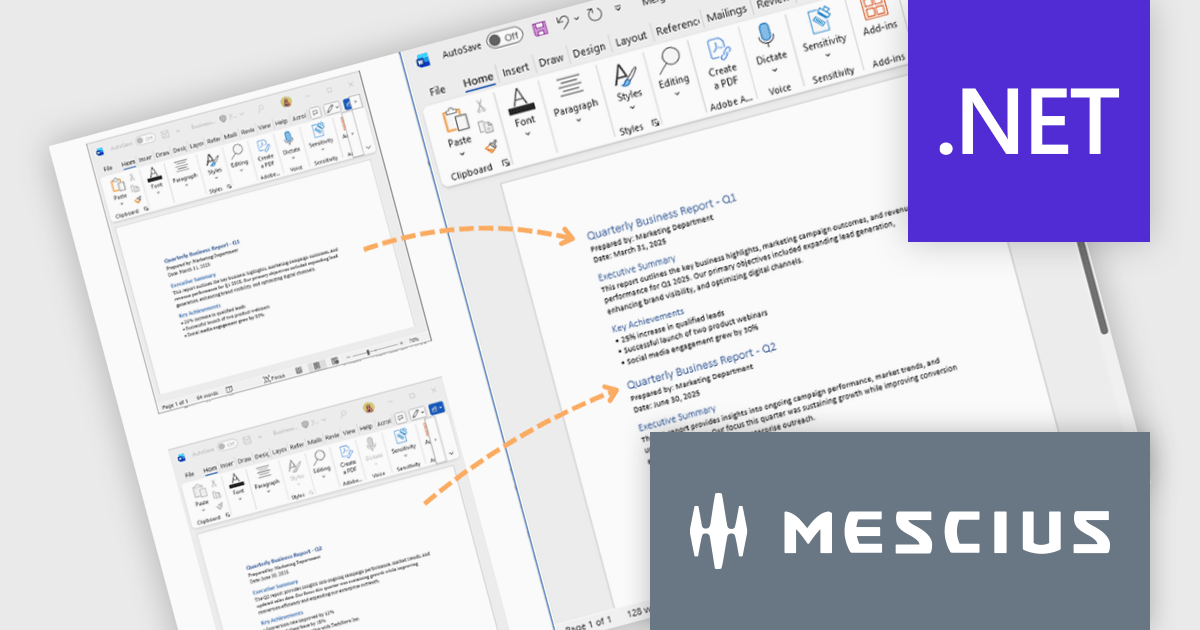
Document Solutions for Word is a comprehensive software development toolkit designed to facilitate the creation, manipulation, and management of Microsoft Word documents within various applications. It offers a robust API that provides developers with granular control over document structure, formatting, and content, enabling the integration of Word document functionality into custom applications. Key features include support for advanced formatting options, document automation, and compatibility with various Word document formats.
In this blog post, MESCIUS Product Marketing Specialist Mackenzie Albitz demonstrates how to use Document Solutions for Word to split large DOCX files into multiple documents and merge separate Word files into a single, properly formatted output. The steps include:
Detailed source code and examples are included to get you started.
Read the complete blog to learn how to efficiently split and merge Word DOCX files in .NET applications.
Document Solutions for Word is licensed per developer and is available in several license options for differing distribution needs. Team licenses are also available for multiple developers within the same organization. See our Document Solutions for Word licensing page for full details.
Document Solutions for Word is available to buy individually or as part of Document Solutions .NET Bundle.
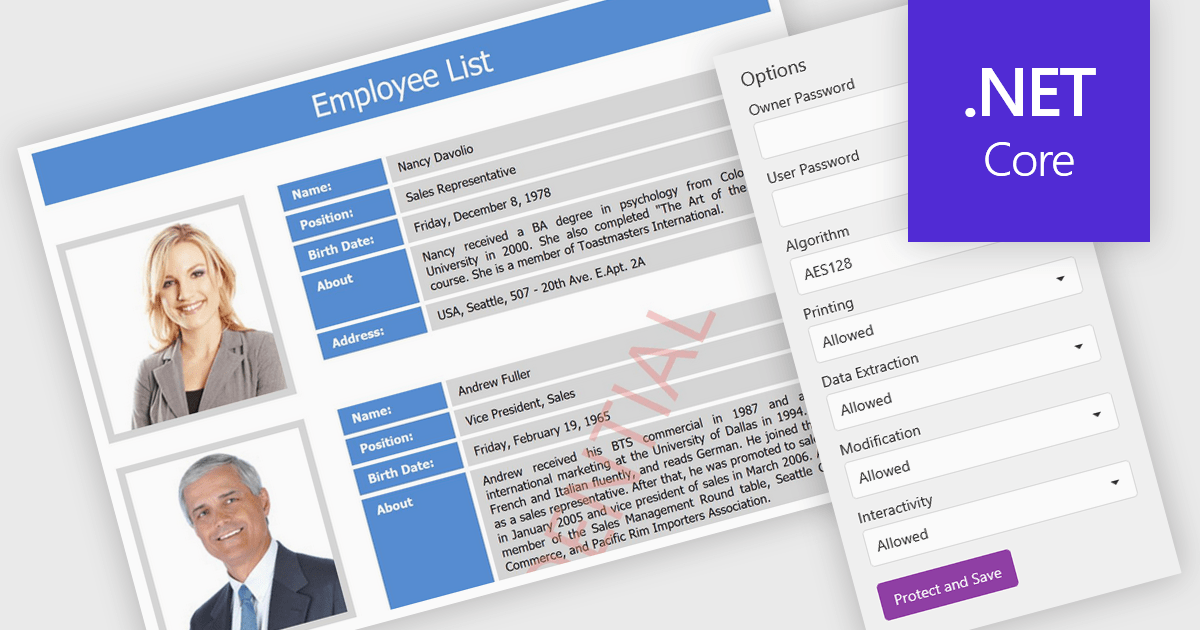
PDF password protection is a security feature that lets users encrypt their PDF documents with a password, ensuring that only authorized individuals can open or modify them. This helps safeguard sensitive information such as financial reports, contracts, and client data from unauthorized access or misuse. Users can also control permissions by preventing printing, copying, or editing to maintain document integrity. The benefits include stronger data privacy, compliance with regulations like GDPR and HIPAA, and greater trust when sharing confidential files within or outside an organization. Common uses include securing legal agreements, financial statements, and proprietary business information.
Several .NET Core PDF components allow you to protect PDFs with passwords, including:
For an in-depth analysis of features and price, visit our .NET Core PDF controls comparison.
電話: (888) 850 9911
Fax: +1 770 250 6199


