


公式サプライヤー
公式および認定ディストリビューターとして200社以上の開発元から正規ライセンスを直接ご提供いたします。
当社のすべてのブランドをご覧ください。
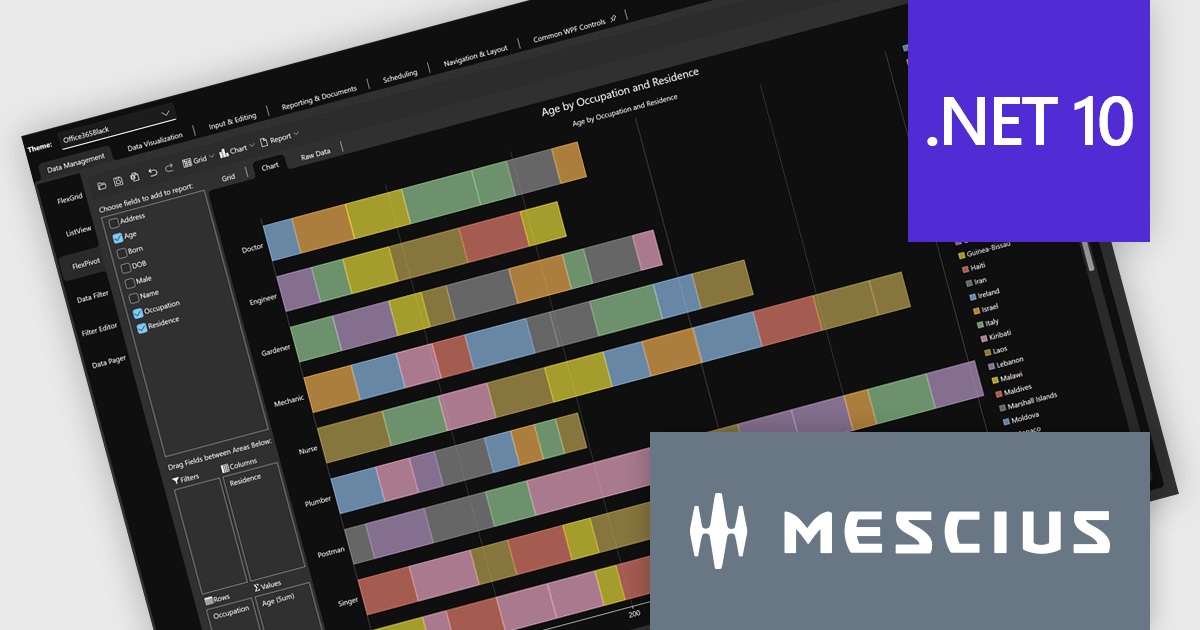
The ComponentOne Studio range by MESCIUS (formerly GrapeCity) is a comprehensive suite of UI controls for building rich, responsive, and cross-platform applications. It provides a wide range of components for desktop, web, and mobile development including high performance datagrids, charts, reporting components, dashboards, and other UI controls.
The latest release of .NET 10 has introduced noticeable gains in performance, memory usage, and deployment efficiency that elevate how ComponentOne controls operate across WinForms, WPF, Blazor, and MAUI. With smarter JIT optimizations, faster execution paths, enhanced AOT publishing, and expanded APIs for security, globalization, and JSON handling, applications become quicker to load, lighter to distribute, and more responsive during real-time workloads. These improvements also extend through the ecosystem, bringing refinements to desktop, web, and cross-platform stacks for a more unified development experience.
Developers can fully leverage these enhancements through ComponentOne’s comprehensive UI suite, which now supports .NET 10 across all major platforms with updated NuGet packages and optimized control behavior. Building modern interfaces is easier thanks to better runtime performance, enhanced tooling, and new features like WinForms dark mode for improved visual consistency. The migration process remains straightforward: update dependencies, verify UI behavior, and continue development using familiar practices - now supported by greater stability, faster builds, and a more efficient coding environment.
ComponentOne Studio products are licensed per developer on a perpetual basis and include a 12 month subscription. Priority Support is also available. See our ComponentOne Studio Enterprise licensing page for full details.
For more information, visit our ComponentOne Studio product pages:

The NEW Highcharts Grid Pro provides IT professionals with a powerful JavaScript component to build interactive and customizable data grids which enable efficient data editing, filtering, and management within complex datasets, enhancing the usability of data-intensive applications across various technical fields.
On Wednesday, November 19th at 1:00 PM EST, Highcharts Chief Product Officer Øystein Moseng & Product Manager Stian Totland will be presenting a LIVE tutorial-stye and interactive walkthrough of Grid Pro, demonstrating how to edit and validate data seamlessly with Grid Pro's intuitive tools.
As part of the official launch of Highcharts Grid Pro, this webinar will guide you through the many powerful feature of Grid Pro, including:
Register for the LIVE Webinar today and mark your calendar for November 19th!
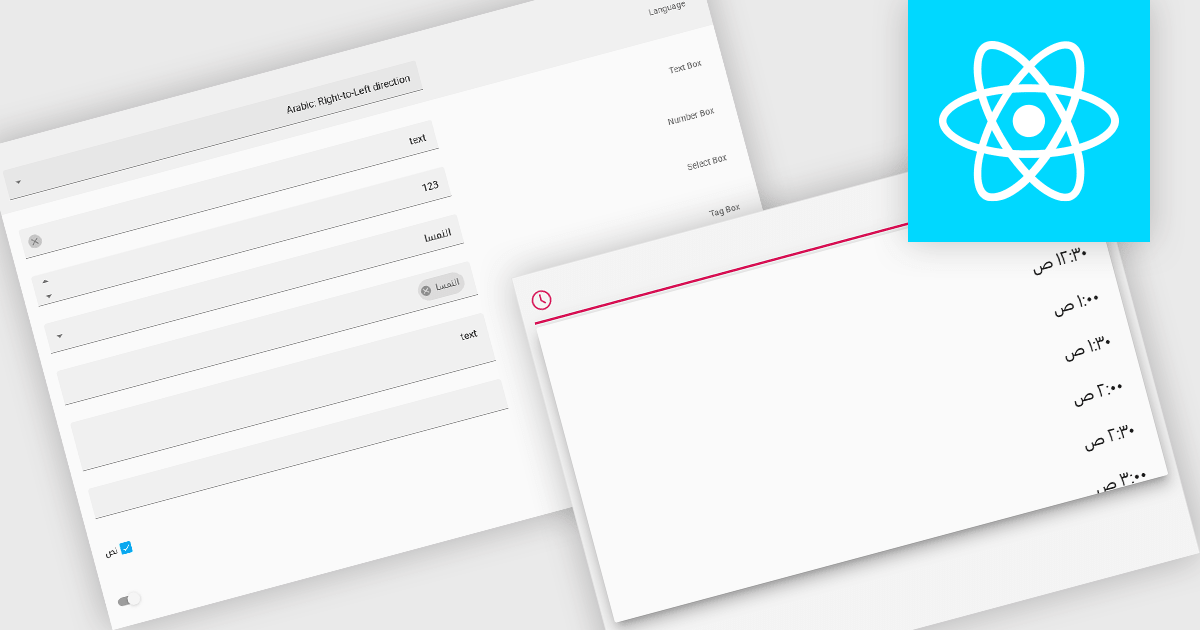
Right-to-left (RTL) support in a data editor component enables the user interface and content layout to be displayed in a direction consistent with languages that are read from right to left, such as Arabic or Hebrew. This includes aligning text, input fields, table structures, and control elements to the right side of the screen, while preserving correct data formatting and interaction behavior. For software developers, RTL support ensures that applications can be properly localized for RTL language audiences without compromising usability or data readability.
Several React data editors offer right to left (RTL) support including:
For an in-depth analysis of features and price, visit our React data editors comparison.

Live data support for charts enables visualizations to update automatically as new information arrives, turning static dashboards into continuously refreshed, real-time views. This reduces reliance on manual refreshes or scheduled reports and helps prevent decisions based on stale data. Teams gain immediate insight into changing conditions, spotting anomalies, performance issues, or opportunities as they emerge. Typical use cases include monitoring website traffic, application performance, financial markets, IoT sensors, and business KPIs such as orders, revenue, or support queues. By making current metrics instantly visible, live charts improve responsiveness, operational control, and confidence in data-driven decisions and outcomes across the organization.
Several React chart controls support live data including:
For an in-depth analysis of features and price, visit our React chart controls comparison.
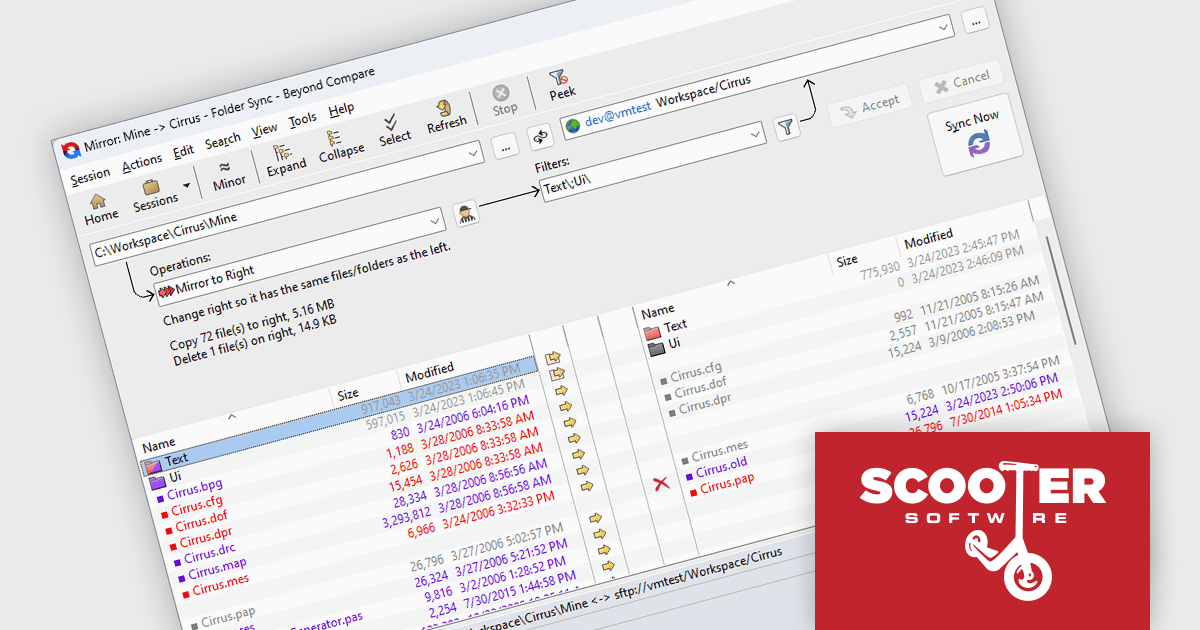
Beyond Compare by Scooter Software is a powerful tool designed for software developers to efficiently compare files and folders. It facilitates detailed analysis and merges of text files, including source code, and it supports numerous file formats and encoding types. The software's intuitive interface enables users to synchronize directories, compare entire drives, and verify backups. Additionally, Beyond Compare offers advanced features such as scripting, integrated FTP, and version control system integration, making it an essential tool for maintaining code integrity.
Scooter Software folder synchronization gives software developers a fast, automated way to keep code, assets, and configuration directories consistently aligned across local, network, and remote locations, eliminating repetitive manual copy-and-delete tasks. By applying predictable, rules-based synchronization, it reduces deployment and backup errors, simplifies environment maintenance, and frees developers to focus on building and shipping features rather than managing files.
Beyond Compare is licensed either per user or per workstation. A single user license allows one person to use Beyond Compare on any number of computers, or on a single workstation shared by several users. The Site License allows an organization to have unlimited users at a single physical site. The Enterprise License allows a company to have an infinite number of users across various sites. See our Beyond Compare licensing page for full details.
Learn more on our Beyond Compare product page.
電話: (888) 850 9911
Fax: +1 770 250 6199


