


公式サプライヤー
公式および認定ディストリビューターとして200社以上の開発元から正規ライセンスを直接ご提供いたします。
当社のすべてのブランドをご覧ください。
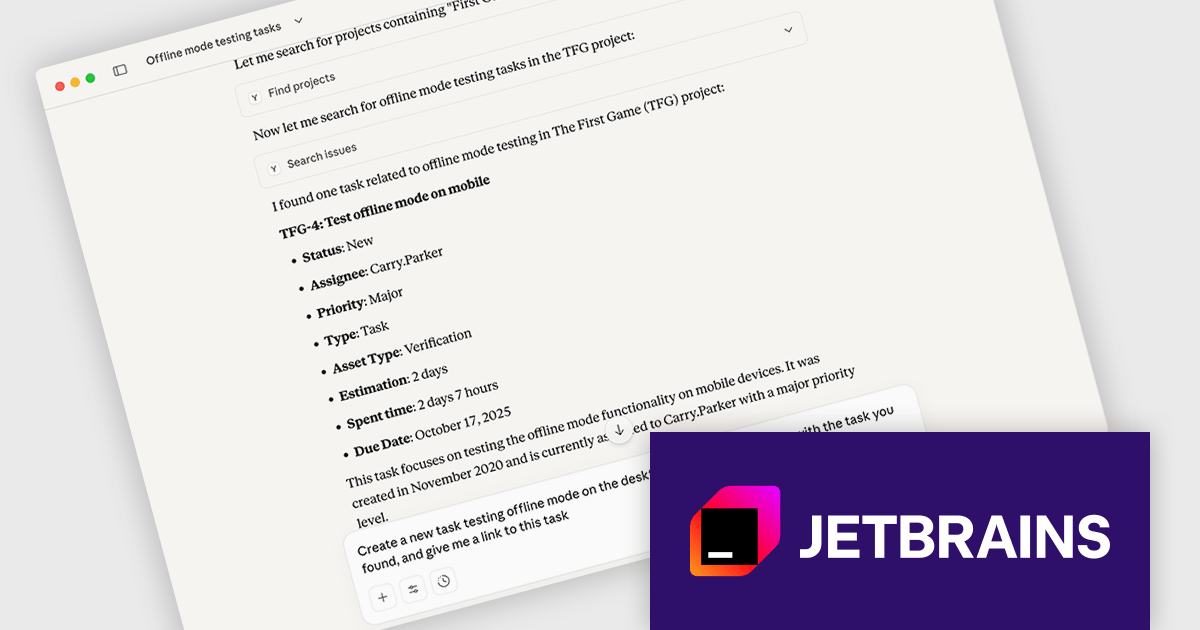
JetBrains YouTrack is a versatile project management and collaboration tool designed for both software development and non-technical teams. Powered by a robust and flexible issue tracking core, YouTrack provides comprehensive features for managing tasks, projects, and workflows of any size. Its intuitive interface fosters efficient collaboration and communication, while agile boards and reporting tools offer real-time visibility and control. Available in both cloud and on-premises options, YouTrack scales effortlessly to accommodate small startups and large enterprises alike, making it a powerful solution for teams seeking to streamline their work and boost productivity.
The YouTrack 2025.3 release introduces support for remote Model Context Protocol (MCP) servers, making it easier to integrate AI-powered tools into your projects. This update allows large language models (LLMs), integrated development environments (IDEs), and agent platforms to perform predefined actions - such as creating issues, logging time, or retrieving task details - without requiring context switching. The connection is secure and highly customizable, offering built-in capabilities alongside support for apps that extend the server’s functionality. For developers working with AI, this enables the creation of tailored apps that interact with YouTrack based on specific team needs, improving efficiency across tools and environments.
To see a full list of what's new in version 2025.3, see our release notes.
YouTrack Server (installed on your server) is licensed per server and per user, as a Perpetual license with 1 year of free updates and technical support. YouTrack Cloud (hosted in the cloud by JetBrains) is licensed per user as an Annual license which includes updates and technical support. See our YouTrack licensing page for full details.
For more information, visit our YouTrack product page.
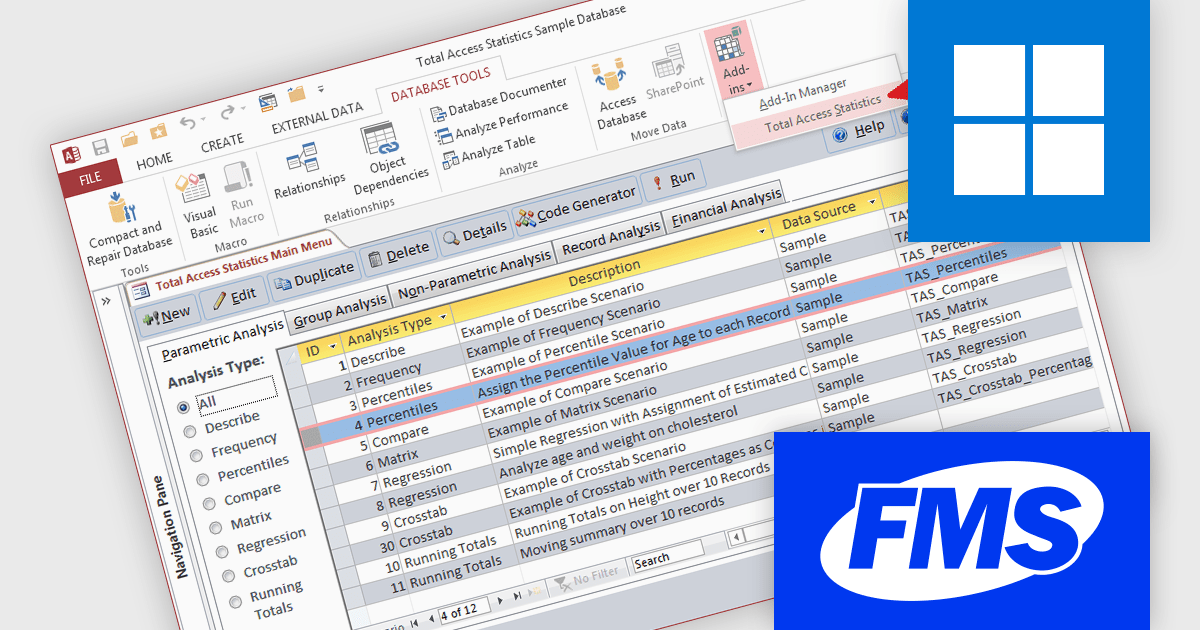
Total Access Statistics by FMS is a powerful Microsoft Access add-in that delivers comprehensive statistical analysis directly within the Access environment. It integrates seamlessly with Access databases, allowing users to perform advanced statistical functions without relying on external tools or programming knowledge. Supporting both native Access tables and linked data sources such as SQL Server, it provides a flexible and efficient solution for analyzing large volumes of data across multiple fields, queries, or tables.
The benefits of Total Access Statistics extend to professionals who need accurate data insights for decision making and reporting. Users can easily identify trends, correlations, and patterns within their datasets while maintaining data integrity inside Access. Its ability to handle unlimited records and complex multi table queries makes it ideal for researchers, analysts, and business users managing large or relational datasets. By simplifying statistical analysis and automating complex calculations, Total Access Statistics saves time, enhances productivity, and ensures reliable results within a familiar and user friendly Access interface.
Total Access Statistics is licensed per user and is available as a perpetual license with an optional annual support subscription, which includes telephone and email technical support as well as upgrades. See our Total Access Statistics Total Access Statistics licensing page for full details.
For more information, see our Total Access Statistics product page.
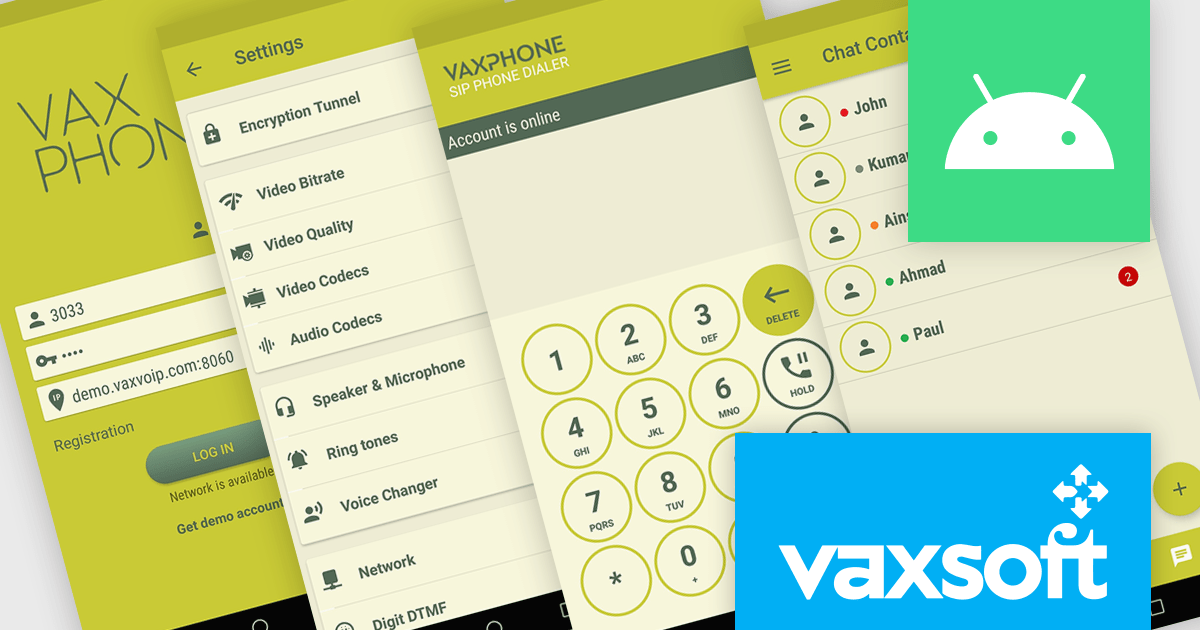
VaxVoIP Android SIP Phone SDK by VaxSoft is a comprehensive software development kit that helps developers create, customize, and distribute SIP based VoIP softphones for Android platforms. It provides all the essential tools to integrate Session Initiation Protocol functionality into mobile applications, supported by straightforward sample code and a fully customizable user interface. The SDK allows developers to build high performance communication solutions that reflect their brand identity and meet specific technical requirements.
With its SIP integration and flexible design options, the VaxVoIP Android SIP Phone SDK improves VoIP app development and shortens time to market. Developers can create tailored softphones for businesses, call centers, or service providers, delivering secure, reliable, and high quality voice communication. Whether used to build branded enterprise communication tools, customer support applications, or specialized telephony systems, the SDK provides the scalability, control, and performance needed to power VoIP experiences on Android devices.
VaxVoIP Android SIP Phone SDK is licensed per product, per year, under a single software brand license that permits use for one application with limited distribution rights. Developers may distribute compiled applications to end users but cannot redistribute the SDK or source code, and all software must operate with the license holder’s own SIP server or service. See our VaxVoIP Android SIP Phone SDK licensing page for full details.
For more information, visit our VaxVoIP Android SIP Phone SDK product page.
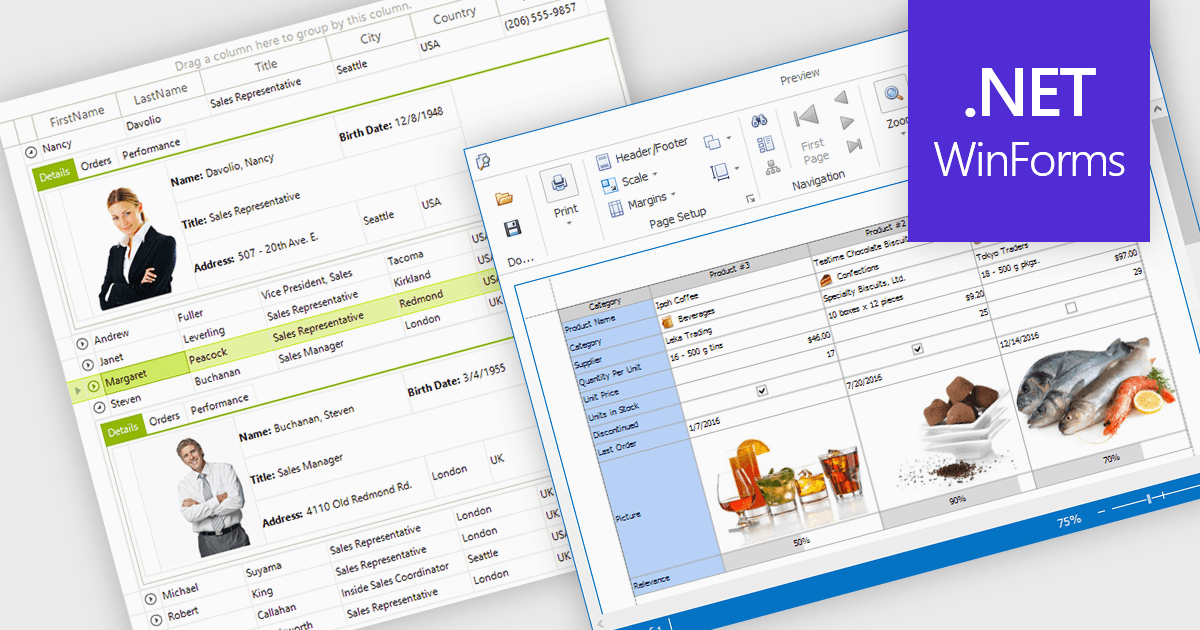
Displaying an image within a grid cell allows developers to combine visual and textual data, making information more intuitive and engaging. This feature enables images such as icons, product photos, or user avatars to appear directly alongside related values, providing immediate visual context and helping users quickly interpret complex datasets. The result is a more dynamic and user-friendly interface that enhances clarity, recognition, and overall usability. Common use cases include showing product images in inventory lists, employee photos in directories, or country flags in international sales reports, allowing users to connect visuals with data for faster understanding and improved decision-making.
Many .NET WinForms grid controls support displaying images within cells, including:
For an in-depth analysis of features and price, visit our comparison of .NET WinForms Grid Controls.
IMAP support enables applications to interact with mail servers using the Internet Message Access Protocol, allowing messages to be retrieved, searched, and managed directly on the server. This protocol maintains synchronization between the client and the server, preserving message state across multiple devices. For developers, integrating IMAP provides a consistent way to access and manipulate email data without requiring full message downloads, reducing local storage needs and improving responsiveness in applications that handle email communication.
Several .NET Comms & Messaging components offer IMAP support including:
For an in-depth analysis of features and price, visit our comparison of .NET Comms & Messaging.
電話: (888) 850 9911
Fax: +1 770 250 6199


