プレゼンテーションレイヤーコンポーネント / MindFusion Group / Vizuly / InfoSoft Global / IDERA / Keyoti
Add platform independent diagramming to your application.
Automatic Layout Algorithms - Diagrams can be arranged automatically by calling a single method and each algorithm provides numerous customization properties. Layouts include: layered, spring-embedder, tree, fractal, treemap and flowchart.
Create highly customized and unique data visualizations.
Scatter Plot Chart - Shows three dimensions of data at once by plotting values along both the X and Y axis as well as the radius of the plot itself. Each plot can be colored and styled dynamically based on your data.
Add charting functionality to your Windows Forms applications.
- Includes graph, line, area, bar, pie and doughnut components
- Charts can have different styles, colors, fonts and pictures
- Royalty free distribution
Enhance your Web apps with diagramming and graphing capabilities.
- Provides interactive online creation of attractive diagrams for workflow processes, object hierarchies and relationships, graphs and more
- Supports two usage modes: Java applet and HTML image map
SharePointのプラグ&プレイダッシュボードでいろいろな分析結果をわかりやすく表示
- グラフ作成用のデータは、SharePoint®のリストやビュー、CSV文字列やファイル、MS SQL Server、Oracle、Excel、ビジネスデータカタログから取得可能
- SharePoint Server 2016、2013、2010、およびWindows SharePoint Services 3.0とMicrosoft Office SharePoint Server 2007と共に使用可能
- 指定したレベルまでドリルダウン、グラフを画像やPDF、Excel、PowerPointにエクスポート
Add work flow diagrams to your applications.
- Create and present work flow, algorithm, and process diagrams, object hierarchy and relationship charts, graphs and trees
- Provides more than 70 predefined box shapes, plus user defined boxes
Enhance your .NET apps with diagramming and graphing capabilities.
- Contains object hierarchy and relationship charts, graphs and trees
- Over 100 predefined box shapes, as well as custom-designed boxes
- Tables, boxes and arrows can be grouped to form complex structures
Professional flowchart Java control enables customized diagrams and charts.
- Draw diagrams for workflow processes, object hierarchies & relationships, graphs & networks, organizational charts, XML documents and more
- Royalty free redistribution and source code is available
-
説明:
Add calendar and scheduling functionality to your.NET MAUI applications. MindFusion.Scheduling for.NET MAUI is a scheduling library for applications that target Android, iOS and need to run on macOS and Windows machines. The calendar component offers five ...
続きを読む
この製品についてさらに結果を表示します。
-
説明:
.NET MAUIのアプリケーションにカレンダーと予定表の機能を追加 MindFusion.Scheduling for.NET MAUI is a scheduling library for applications that target Android, iOS and need to run on macOS and Windows machines. The calendar component offers five schedule views, including single month ...
続きを読む
-
説明:
Outstanding diagrams for any platform, on any device. MindFusion.Diagramming for.NET MAUI is a general-purpose software component that can be used to display many different types of diagrams and charts. It is implemented as a.NET MAUI control and can be ...
続きを読む
この製品についてさらに結果を表示します。
-
説明:
あらゆるプラットフォーム、あらゆるデバイスに対応する優れたダイアグラム MindFusion.Diagramming for.NET MAUI is a general-purpose software component that can be used to display many different types of diagrams and charts. It is implemented as a.NET MAUI control and can be easily integrated ...
続きを読む
-
説明:
Grids, Diagramming, Scheduling, Charts and UI for JavaScript apps. MindFusion.JavaScript Pack includes interactive JavaScript libraries that are easy to use and easy to customize. Users can perform a variety of actions on any of the JavaScript components ...
続きを読む
この製品についてさらに結果を表示します。
-
説明:
JavaScriptでアプリを開発するためのグリッド、図表、スケジュール、グラフ、UIコンポーネントのライブラリ MindFusion.JavaScript Pack includes interactive JavaScript libraries that are easy to use and easy to customize. Users can perform a variety of actions on any of the JavaScript components included ...
続きを読む
-
説明:
Convert all your data in SharePoint into interactive data grids with pivoting capabilities. With Collabion Data Grid for SharePoint you can convert all your data in SharePoint into interactive data grids with pivoting capabilities. Easily add aggregated ...
続きを読む
この製品についてさらに結果を表示します。
-
説明:
SharePointにあるデータを集計機能付きのインタラクティブなグリッドに変換 With Collabion Data Grid for SharePoint you can convert all your data in SharePoint into interactive data grids with pivoting capabilities. Easily add aggregated values, format rows and columns based on conditional ...
続きを読む
-
説明:
Visualize all your business or operational data stored anywhere in SharePoint. Collabion DataParts helps you find insights from all your data stored in SharePoint. The easy-to-use interface allows you to quickly visualize data, explore patterns, monitor ...
続きを読む
この製品についてさらに結果を表示します。
-
説明:
SharePointに保存したあらゆるビジネスデータを視覚化 Collabion DataParts helps you find insights from all your data stored in SharePoint. The easy-to-use interface allows you to quickly visualize data, explore patterns, monitor trends and finally share your discoveries, ...
続きを読む
-
説明:
Add charts and visualizations to your JavaScript apps. Vizuly Professional includes Corona, Halo, Radial Bar, Ring Chart, Weighted Tree, Geo Plot, Bar Chart, Column Chart, Line Area Chart, Radar Chart, Radial Progress, Scatter Plot, Sunburst, Tree Map, ...
続きを読む
この製品についてさらに結果を表示します。
-
説明:
JavaScriptアプリに多種多様なグラフを追加 Vizuly Professional includes Corona, Halo, Radial Bar, Ring Chart, Weighted Tree, Geo Plot, Bar Chart, Column Chart, Line Area Chart, Radar Chart, Radial Progress, Scatter Plot, Sunburst, Tree Map, Venn Diagram and Word Cloud. It ...
続きを読む
-
説明:
Add Word Clouds to your JavaScript apps. Vizuly Word Cloud is a unique way to represent the occurrence rate of words within a given text stream. This visualization supports an exclusion list that will ignore common pronouns, profanity, or any words you ...
続きを読む
この製品についてさらに結果を表示します。
-
説明:
JavaScriptアプリにワードクラウドを追加 Vizuly Word Cloud is a unique way to represent the occurrence rate of words within a given text stream. This visualization supports an exclusion list that will ignore common pronouns, profanity, or any words you decide it should ...
続きを読む
-
説明:
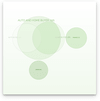
Add Venn Diagram charts to your JavaScript apps. Vizuly Venn Diagram shows all possible logical relations between a finite collection of different sets. This chart depicts elements as points in the plane, and sets as regions inside closed curves. A Venn ...
続きを読む
この製品についてさらに結果を表示します。
-
説明:
JavaScriptアプリにベン図を追加 Vizuly Venn Diagram shows all possible logical relations between a finite collection of different sets. This chart depicts elements as points in the plane, and sets as regions inside closed curves. A Venn diagram consists of multiple ...
続きを読む
-
説明:
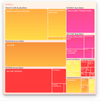
Add Tree Map charts to your JavaScript apps. Vizuly Tree Map visualizes hierarchical data in nested rectangular plots where the area of each rectangle is bound to a data property you can set. This TreeMap also supports the ability to drill down/up, in ...
続きを読む
この製品についてさらに結果を表示します。
-
説明:
JavaScriptアプリにツリーマップを追加 Vizuly Tree Map visualizes hierarchical data in nested rectangular plots where the area of each rectangle is bound to a data property you can set. This TreeMap also supports the ability to drill down/up, in addition to a navigation ...
続きを読む
-
説明:
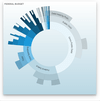
Adds Sunburst charts to your JavaScript apps. Vizuly Sunburst is designed to represent hierarchical data in a radial plot. It supports drill down and drill up capabilities by allowing the user to collapse and expand segments of the sunburst when they ...
続きを読む
この製品についてさらに結果を表示します。
-
説明:
JavaScriptアプリにサンバーストグラフを追加 Vizuly Sunburst is designed to represent hierarchical data in a radial plot. It supports drill down and drill up capabilities by allowing the user to collapse and expand segments of the sunburst when they click on that area. ...
続きを読む


