
Vizuly Tree Map(英語版)
JavaScriptアプリにツリーマップを追加
Vizuly Professional includes all Vizuly components at a significant discount.
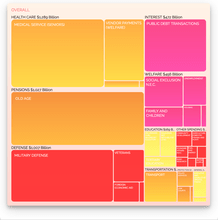
Vizuly Tree Map visualizes hierarchical data in nested rectangular plots where the area of each rectangle is bound to a data property you can set. This TreeMap also supports the ability to drill down/up, in addition to a navigation “bread-crumb” at the top of the visualization. In addition to several different fill/stroke styles you can adjust the padding between and within elements and provide header titles to each section.


画像1 / 6
Features
Framework Adapters
Vizuly Tree Map(英語版)は、次の製品にも含まれています。
今すぐ Vizuly ライセンススペシャリストとライブ チャット。
電話: (888) 850 9911
Fax: +1 770 250 6199


 のスクリーンショット")