PDFlib+PDI(英語版)
PDF文書を作成・操作するため開発者向けツール
PDFに変換 - TIFFやJPEG、SVGなどの画像ファイルをPDFに変換します。 PDFlibをさまざまなアプリケーションに組み込んで、常に高品質なPDFファイルを出力できます。.

説明: All the Software FX products in one package. Studio FX Subscription offers access to the entire line of Software FX data visualization products for developers, including.NET, Java, COM, SharePoint, iOS and mobility products. Licensed on a per developer ... 続きを読む

説明: Add interactive charts and images to your Web and Windows applications. Chart FX 7 integrates seamlessly into Visual Studio to provide developers with enterprise level data visualization capabilities. Chart FX 7 takes full advantage of the.NET Framework ... 続きを読む

説明: Generate PDFs on the fly. PDFlib is a development tool for PDF-enabling your software or generating PDFs on your server. PDFlib offers a simple-to-use API for programmatically creating PDF files from within your own server-side or client-side software. ... 続きを読む

説明: Text extraction toolkit. PDFlib TET (Text Extraction Toolkit) reliably extracts text, images and metadata from any PDF file. It is available as a library/component and as a command-line tool. PDFlib TET makes available the text contents of a PDF as ... 続きを読む

説明: PDF Linearization, Optimization, Protection and Digital Signatures. PDFlib PLOP DS (Digital Signature) offers all features of PLOP, plus the ability to apply digital signatures to PDF documents. PDFlib PLOP is a versatile tool which can repair, linearize, ... 続きを読む

説明: Generate PDF documents on-the-fly. PDFlib is a component that allows you to programmatically create PDF files from within your own server-side or client-side software. PDFlib doesn't make use of third-party software for generating PDFs, nor does it ... 続きを読む

説明: A radial line and area layout visualization. Vizuly Corona is a radial chart that provides angular and curved radial area line curves and supports both an overlap and stacked layout. It also features over a dozen different dynamic styles and comes bundled ... 続きを読む

説明: Represent transactional relationships from a specified number of sources to a variable number of targets. Vizuly Halo uses several different data visualization techniques to represent transactional relationships from a specified number of sources to a ... 続きを読む

説明: Represent cartesian x/y data within a radial plot. Vizuly Radial Bar is designed to represent cartesian x/y data within a radial plot. It supports both clustered and stacked radial bars Use the interactive style explorer on the left to view different ... 続きを読む

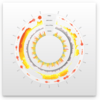
説明: Easily display multi-variate time series information. Vizuly Ring Chart lets you easily display multi-variate time series information. Due to its radial form factor, you can display 3 times the information for a given screen width than you could with a ... 続きを読む