コンポーネント / Vizuly / MDBootstrap

  1. $ | 購入

    説明: Elevate your Web development experience with premium Angular components and professional support. MDB Pro Angular is a complete UI Toolkit consisting of 5000+ components (including 740+ Design Blocks, 47+ Plugins and 224+ Templates) with modularity, ... 続きを読む

  2. $ | 購入

    説明: Elevate your Web development experience with premium React components and professional support. MDB Pro React is a complete UI Toolkit consisting of 5000+ components (including 740+ Design Blocks, 47+ Plugins and 224+ Templates) with modularity, source ... 続きを読む

  3. $$ | 購入

    説明: Elevate your Web development experience with premium components and professional support. MDB Pro Bundle includes all MDB Pro editions; Standard (plain Bootstrap), Angular, React and Vue. Create responsive, aesthetically pleasing websites. Resolve styling ... 続きを読む

  4. $ | 購入

    説明: Elevate your Web development experience with premium Vue components and professional support. MDB Pro Vue is a complete UI Toolkit consisting of 5000+ components (including 740+ Design Blocks, 47+ Plugins and 224+ Templates) with modularity, source code ... 続きを読む

  5. $ | 購入

    説明: Elevate your Web development experience with premium JavaScript components and professional support. MDB Pro Standard (plain Bootstrap) is a complete UI Toolkit consisting of 5000+ components (including 740+ Design Blocks, 47+ Plugins and 224+ Templates) ... 続きを読む

  6. $$$ | 購入

    説明: Add charts and visualizations to your JavaScript apps. Vizuly Professional includes Corona, Halo, Radial Bar, Ring Chart, Weighted Tree, Geo Plot, Bar Chart, Column Chart, Line Area Chart, Radar Chart, Radial Progress, Scatter Plot, Sunburst, Tree Map, ... 続きを読む

  7. $ | 購入

    説明: Add Word Clouds to your JavaScript apps. Vizuly Word Cloud is a unique way to represent the occurrence rate of words within a given text stream. This visualization supports an exclusion list that will ignore common pronouns, profanity, or any words you ... 続きを読む

  8. $ | 購入

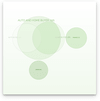
    説明: Add Venn Diagram charts to your JavaScript apps. Vizuly Venn Diagram shows all possible logical relations between a finite collection of different sets. This chart depicts elements as points in the plane, and sets as regions inside closed curves. A Venn ... 続きを読む

  9. $ | 購入

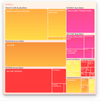
    説明: Add Tree Map charts to your JavaScript apps. Vizuly Tree Map visualizes hierarchical data in nested rectangular plots where the area of each rectangle is bound to a data property you can set. This TreeMap also supports the ability to drill down/up, in ... 続きを読む

  10. $ | 購入

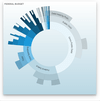
    説明: Adds Sunburst charts to your JavaScript apps. Vizuly Sunburst is designed to represent hierarchical data in a radial plot. It supports drill down and drill up capabilities by allowing the user to collapse and expand segments of the sunburst when they ... 続きを読む