TrueChart for Windows Forms(日本語版)
豊富なグラフ種と多彩なスタイル、精細なグラフ作成が可能に
- 軸タイトルや軸ラベルなどのテキストを縦書きで表示
- 時計回り、反時計回りの円グラフを選択して表示することが可能
- 積層棒グラフに区分線を表示する機能を追加

スクリーンショット: The Seven Segment Integer control is a seven-segment display used for displaying Integer values. If the Value overflows the display in the positive direction, then up arrows will be shown. If the Value overflows the display in the negative direction, then ... 続きを読む この製品についてさらに結果を表示します。
スクリーンショット: The Seven Segment Integer control is a seven-segment display used for displaying Integer values. If the Value overflows the display in the positive direction, then up arrows will be shown. If the Value overflows the display in the negative direction, then ... 続きを読む
スクリーンショット: The Phone Pad Control is a simple numeric keypad control with mouse control support. Input is processed in your application by using the OnKeyClick event. ... 続きを読む

スクリーンショット: With Iocomp.NET WinForms Plot Pack you can create professional real-time plotting/charting type applications in.NET development environments. ... 続きを読む この製品についてさらに結果を表示します。
スクリーンショット: With Iocomp.NET WinForms Plot Pack you can create professional real-time plotting/charting type applications in.NET development environments. ... 続きを読む
スクリーンショット: Iocomp.NET WinForms Plot Pack lets you zoom & scroll while plotting. ... 続きを読む

スクリーンショット: Annotations can be placed on the report to pass notes and special instructions on to users and developers. ... 続きを読む この製品についてさらに結果を表示します。
スクリーンショット: Allow end users to edit their reports and save new reports or load old ones. ... 続きを読む
スクリーンショット: The WebViewer Control provided in the Professional Edition allows you to write less code and view reports more quickly. ... 続きを読む

スクリーンショット: Master Reports allow developers (or the end-user) to define a template that can then be filled in by other reports. ... 続きを読む この製品についてさらに結果を表示します。
スクリーンショット: Master Reports allow developers (or the end-user) to define a template that can then be filled in by other reports. ... 続きを読む
スクリーンショット: The included Barcode report item supports 23 of the most popular barcode symbologies, from Code39 to UPC, PostNET, and JapanesePostal. ... 続きを読む

スクリーンショット: Charts, pivot tables and data visualization in one programmable control. ... 続きを読む この製品についてさらに結果を表示します。
スクリーンショット: Rich drag-and-drop user experience encourages self-discovery of data. ... 続きを読む
スクリーンショット: Excel exports allow end users to share analysis results offline. ... 続きを読む

スクリーンショット: Includes all of the features found in RDL and has added several enhancements. ... 続きを読む この製品についてさらに結果を表示します。
スクリーンショット: Screenshot of ActiveBI Suite for.NET 続きを読む
スクリーンショット: Screenshot of ActiveBI Suite for.NET 続きを読む

スクリーンショット: ComponentOne PDF for WinForms 2009 PDF now supports AcroForms/AcroFields support. You can create Acrobat forms with the following filed types: textbox, checkbox, radio button, push button, combo box, and list box ... 続きを読む この製品についてさらに結果を表示します。
スクリーンショット: ComponentOne Studio for ASP.NET 2009 Release adds more interaction on the client-side with new lightweight, high-performance controls: GridView, ToolBar, Editor, Schedule, Calendar, and Input. ComponentOne Schedule for ASP.NET has the same object model as ... 続きを読む
スクリーンショット: Add advanced data visualization to your Silverlight applications with ComponentOne DataGrid for Silverlight. The robust data-bound C1DataGrid control makes it easy to display, edit, and analyze tabular data in Silverlight applications. ComponentOne ... 続きを読む

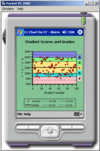
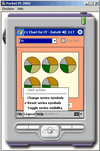
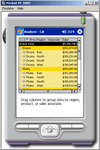
スクリーンショット: Screenshot of ComponentOne Studio for Compact Framework 続きを読む この製品についてさらに結果を表示します。
スクリーンショット: Screenshot of ComponentOne Studio for Compact Framework 続きを読む
スクリーンショット: Screenshot of ComponentOne Studio for Compact Framework 続きを読む

スクリーンショット: A range of possible styles available for data display. ... 続きを読む この製品についてさらに結果を表示します。
スクリーンショット: Display a chart of the Pocket PC's memmory load. ... 続きを読む
スクリーンショット: Set alarm trigers on your charts. ... 続きを読む

スクリーンショット: Analyse your grid data. ... 続きを読む この製品についてさらに結果を表示します。
スクリーンショット: Create bar charts from your grid data. ... 続きを読む
スクリーンショット: Edit the data held in your grid. ... 続きを読む