Fast Reports / Vizuly / Divcom Software - ベストセラー商品
Create highly customized and unique data visualizations.
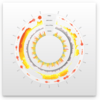
Corona Chart - This radial chart provides angular and curved radial area line curves and supports both an overlap and stacked layout. It also features over a dozen different dynamic styles and comes bundled with an easy to use test container that demonstrates seven uniquely styled themes.
.NET 5、.NET Core、Blazor、ASP.NET、およびWinFormsのレポート作成機能
Visual Report Designer - ズーム、元に戻す/やり直し、ガイドライン、ルーラーなどをサポート デザイナーでは、既存のレポートを変更するか新しいレポートを作成できるようになり、ランタイムはロイヤリティフリー.
Avalonia UIを使用したクロスプラットフォームアプリケーションでのレポートの生成
- macOS、Linux、Windowsでレポートとドキュメントを単一のコードベースから作成
- 請求書、財務レポート、売上内訳など、ほぼすべてのレポートを作成
- ローカリゼーションは25以上の言語でサポート
A cross-platform, multi-language scripting engine.
- Compatible with Delphi 4-XE2, C++Builder 4-XE2, Kylix 1-3 and Lazarus
- Write scripts in PascalScript, C++Script, JScript and BasicScript
- Offers fast code execution, a small footprint and a wide variety of tools
Multiplatform report generator for Mac OS X and Windows.
- Includes a visual report designer for creating, tuning & editing report templates
- Preview, print or export reports to PDF, TXT, BMP, JPEG, GIF, TIFF, PNG, HTML, ODS, ODT & CSV formats
Effective data analysis tool for Delphi/C++Builder/Lazarus.
- Create reports and diagrams instantly irrespective of database size
- Load data from multiple sources with the same structure
- Now supports Delphi XE2/C++Builder XE2
Delphi/C++Builder/RAD Studio対応レポート作成ツール
- New 2D barcode support includes PDF417, DataMatrix & QR Code
- New exports: HTML5 (div), DOCX, XLSX, PPTX.
- Improved Client/Server reporting works via AJAX technology
Full-featured reporting solution for Mono Framework.
- Create application-independent .NET and Mono reports
- Extendable architecture allows you to create your own objects, export filters, wizards and database engines
-
説明:
Reporting and document creation VCL library for Delphi, C++Builder, RAD Studio and Lazarus. FastReport VCL is an add-on component that allows your application to generate reports quickly and efficiently. FastReport provides all the necessary tools to ...
続きを読む
この製品についてさらに結果を表示します。
-
説明:
Delphi、C++Builder、RAD Studio、Lazarusの帳票と文書作成用ビジュアルコンポーネントライブラリ FastReport®は、レポートを開発するのに必要なツールセットを提供します。それはビジュアルレポートデザイナー、レポートコアおよび「プレビュー」ウィンドウです。そのツールは、Delphi、C++Builder およびRAD Studioの環境で使用されます。 FastReport 4に関する新規情報 レポートデザイナー: 新しいXPスタイルのインタフェース ...
続きを読む
-
説明:
Create application-independent reports. FastReport.NET is a full-featured reporting library for.NET Core, Blazor, ASP.NET, MVC, Windows Forms and WPF (Ultimate Edition only). It can be used in Microsoft Visual Studio and JetBrains Rider. FastReport.NET ...
続きを読む
この製品についてさらに結果を表示します。
-
説明:
アプリケーションに依存しない帳票の作成 FastReport.Netは、データベース、テーブル、クエリーなどに依存せず、どんな環境でもレポーティングを作成することが可能な、全機能のレポーティングソリューションです。そのツールは、Microsoft Visual Studio 2005/2008で使用することができます。レポートの実行前にパラーメタを要求するためにレポートにいくつかのダイアローグフォームを追加し、組み込みスクリプトを使用することで ...
続きを読む
-
説明:
Reporting and document creation library for WPF. FastReport WPF is a powerful library for report generation which allows you to create, view, and export detailed, interactive reports using a lightweight, multi-functional reporting tool. Use it to create ...
続きを読む
この製品についてさらに結果を表示します。
-
説明:
WPF 用のレポートおよびドキュメント作成ライブラリ FastReport WPF is a powerful library for report generation which allows you to create, view, and export detailed, interactive reports using a lightweight, multi-functional reporting tool. Use it to create various reports, from ...
続きを読む
-
説明:
Multi-language scripting engine. FastScript is a cross-platform, multi-language scripting engine. It is useful for programmers who want to add scripting ability to their projects. FastScript can be installed in Embarcadero Delphi, C++Builder and Lazarus. ...
続きを読む
この製品についてさらに結果を表示します。
-
説明:
さまざまな言語のスクリプティングエンジン FastScriptは、クロスプラットフォーム多言のスクリプトエンジンです。そのツールは、プロジェクトにスクリプト作成機能を加えたいプログラマーに役立ちます。FastScriptは、Borland Delphi 4-7、2005、2006、2009、2010, C++Builder 4-6、2005、2006、2007、2009、2010 Kylix 1-3およびLazarusにインストールできます。FastScriptでユニークなのは、多言語 ...
続きを読む
-
説明:
Cross-platform report generator for generating documents in macOS, Linux and Windows. FastReport FMX is a multiplatform report generator for Apple macOS, Linux and Microsoft Windows, compatible with Embarcadero RAD Studio (FMX library). FastReport FMX is ...
続きを読む
この製品についてさらに結果を表示します。
-
説明:
macOS、Linux、およびWindowsでドキュメントを生成するためのクロスプラットフォーム帳票生成ツール FastReport FMX VCLは、レポートをすばやく、効果的に作成できるようにするアドオンコンポーネントです。FastReport FMXは、レポートを開発するのに必要なツールセットを提供します。それはビジュアルレポートデザイナー、レポートコアおよび「プレビュー」ウィンドウです。そのツールは、Embarcadero FireMonkey IDE (Delphi for MS Windows ...
続きを読む
-
説明:
A radial line and area layout visualization. Vizuly Corona is a radial chart that provides angular and curved radial area line curves and supports both an overlap and stacked layout. It also features over a dozen different dynamic styles and comes bundled ...
続きを読む
この製品についてさらに結果を表示します。
-
説明:
放射状の折れ線グラフと面グラフ Vizuly Corona is a radial chart that provides angular and curved radial area line curves and supports both an overlap and stacked layout. It also features over a dozen different dynamic styles and comes bundled with an easy to use test ...
続きを読む
-
説明:
Represent asymmetric hierarchical information in an easy to read visualization. Vizuly Weighted Tree nodes and branches can be dynamically sized and styled based on data bound properties that you set. One challenge with large hierarchal tree structures is ...
続きを読む
この製品についてさらに結果を表示します。
-
説明:
階層構造のデータを非対称のツリーで分かりやすく表示 Vizuly Weighted Tree nodes and branches can be dynamically sized and styled based on data bound properties that you set. One challenge with large hierarchal tree structures is being able to easily navigate the tree when many ...
続きを読む
-
説明:
Represent transactional relationships from a specified number of sources to a variable number of targets. Vizuly Halo uses several different data visualization techniques to represent transactional relationships from a specified number of sources to a ...
続きを読む
この製品についてさらに結果を表示します。
-
説明:
指定された数のソースから可変数のターゲットへの推移を表現 Vizuly Halo uses several different data visualization techniques to represent transactional relationships from a specified number of sources to a variable number of targets. Sources are represented as segmented arcs along the ...
続きを読む
-
説明:
Represent cartesian x/y data within a radial plot. Vizuly Radial Bar is designed to represent cartesian x/y data within a radial plot. It supports both clustered and stacked radial bars Use the interactive style explorer on the left to view different ...
続きを読む
この製品についてさらに結果を表示します。
-
説明:
直交座標のxとyのデータを放射状にプロット Vizuly Radial Bar is designed to represent cartesian x/y data within a radial plot. It supports both clustered and stacked radial bars Use the interactive style explorer on the left to view different style settings, themes, and other ...
続きを読む
-
説明:
Easily display multi-variate time series information. Vizuly Ring Chart lets you easily display multi-variate time series information. Due to its radial form factor, you can display 3 times the information for a given screen width than you could with a ...
続きを読む
この製品についてさらに結果を表示します。
-
説明:
異なる複数の時系列のデータを簡単に表示 Vizuly Ring Chart lets you easily display multi-variate time series information. Due to its radial form factor, you can display 3 times the information for a given screen width than you could with a more traditional cartesian layout. ...
続きを読む


