Dart Communications / Desaware / Vizuly / InstallAware / ComponentArt / SlickEdit
Create highly customized and unique data visualizations.
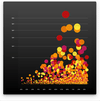
Scatter Plot Chart - Shows three dimensions of data at once by plotting values along both the X and Y axis as well as the radius of the plot itself. Each plot can be colored and styled dynamically based on your data.
Add email functionality to your applications.
- Create, send, retrieve, preview, and edit mail messages, verify email addresses and manage mailboxes remotely
- Includes 35 samples written for 8 different environments
アプリ、システムの低レベルメッセージストリームをインターセプト
- VB ActiveX DLLのエクスポートが可能
- マウストラッキング機能の搭載
- さらに進化したアンチスパイウェアテクノロジー
Create custom TCP or FTP servers for any application.
- Includes: FTP server, TCP server, mail server, DNS server and NT Service ActiveX controls
- Supports COM+ Component Services
Enable communication with network devices and applications.
- Supports SNMPv1, SNMPv2 and the ASN.1 standard
- Includes agent control and manager control, plus Management Information Base (MIB) object, SNMP Message Object and more
Add a cryptographic licensing system to your .NET applications.
- Supports timed demo installations and server activation
- No hidden files, registry entries, or background services needed
- License an unlimited number of applications at no extra cost
All of Desaware's .NET components, with full source code.
- All products now fully compatible with Windows Vista
- NEW SpyWorks V8.0 features improved handling of Windows hooks, particularly with regard to recovery from application crashes
Add secure SSH session and file transfer capabilities to .NET applications.
- Supports username/password and PEM public key authentication
- Features synchronous and asynchronous operation modes
- Includes comprehensive samples for C# and VB.NET developers
WindowsアプリとWebアプリにTelnet、rsh、rexec、rloginで接続する機能を追加
- 国際文字セットをサポート
- 自動ログインとオプションのネゴシエーション機能によりコードの記述量を低減
- 明示的および暗黙的なSecure Socket Layer(SSL)によるセキュリティを搭載
-
説明:
Interactive image viewer with in-place pan, zoom, and dynamic loading of high resolution images. PowerWEB Zoom for ASP.NET includes the ability to zoom an image in minute detail and smoothly pan across thousands of pixels. You can increase your website’s ...
続きを読む
この製品についてさらに結果を表示します。
-
説明:
高解像度画像をすばやく読み込めるイメージビューアー、便利なパンとズーム機能も搭載 PowerWEB Zoom for ASP.NET includes the ability to zoom an image in minute detail and smoothly pan across thousands of pixels. You can increase your website’s effectiveness by allowing users to directly interact ...
続きを読む
-
説明:
Quick access to SNMP managed devices and agents on your network. PowerSNMP Network Manager is a low-cost, lightweight, easy-to-use network management application. Ideal for providing quick access to SNMP managed devices and agents on your network. Use the ...
続きを読む
この製品についてさらに結果を表示します。
-
説明:
SNMPで管理されている、ネットワーク上のデバイスとエージェントにすばやくアクセス PowerSNMP Network Manager is a low-cost, lightweight, easy-to-use network management application. Ideal for providing quick access to SNMP managed devices and agents on your network. Use the PowerSNMP Network ...
続きを読む
-
説明:
Add charts and visualizations to your JavaScript apps. Vizuly Professional includes Corona, Halo, Radial Bar, Ring Chart, Weighted Tree, Geo Plot, Bar Chart, Column Chart, Line Area Chart, Radar Chart, Radial Progress, Scatter Plot, Sunburst, Tree Map, ...
続きを読む
この製品についてさらに結果を表示します。
-
説明:
JavaScriptアプリに多種多様なグラフを追加 Vizuly Professional includes Corona, Halo, Radial Bar, Ring Chart, Weighted Tree, Geo Plot, Bar Chart, Column Chart, Line Area Chart, Radar Chart, Radial Progress, Scatter Plot, Sunburst, Tree Map, Venn Diagram and Word Cloud. It ...
続きを読む
-
説明:
Add Word Clouds to your JavaScript apps. Vizuly Word Cloud is a unique way to represent the occurrence rate of words within a given text stream. This visualization supports an exclusion list that will ignore common pronouns, profanity, or any words you ...
続きを読む
この製品についてさらに結果を表示します。
-
説明:
JavaScriptアプリにワードクラウドを追加 Vizuly Word Cloud is a unique way to represent the occurrence rate of words within a given text stream. This visualization supports an exclusion list that will ignore common pronouns, profanity, or any words you decide it should ...
続きを読む
-
説明:
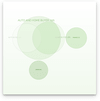
Add Venn Diagram charts to your JavaScript apps. Vizuly Venn Diagram shows all possible logical relations between a finite collection of different sets. This chart depicts elements as points in the plane, and sets as regions inside closed curves. A Venn ...
続きを読む
この製品についてさらに結果を表示します。
-
説明:
JavaScriptアプリにベン図を追加 Vizuly Venn Diagram shows all possible logical relations between a finite collection of different sets. This chart depicts elements as points in the plane, and sets as regions inside closed curves. A Venn diagram consists of multiple ...
続きを読む
-
説明:
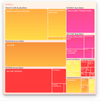
Add Tree Map charts to your JavaScript apps. Vizuly Tree Map visualizes hierarchical data in nested rectangular plots where the area of each rectangle is bound to a data property you can set. This TreeMap also supports the ability to drill down/up, in ...
続きを読む
この製品についてさらに結果を表示します。
-
説明:
JavaScriptアプリにツリーマップを追加 Vizuly Tree Map visualizes hierarchical data in nested rectangular plots where the area of each rectangle is bound to a data property you can set. This TreeMap also supports the ability to drill down/up, in addition to a navigation ...
続きを読む
-
説明:
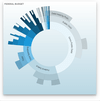
Adds Sunburst charts to your JavaScript apps. Vizuly Sunburst is designed to represent hierarchical data in a radial plot. It supports drill down and drill up capabilities by allowing the user to collapse and expand segments of the sunburst when they ...
続きを読む
この製品についてさらに結果を表示します。
-
説明:
JavaScriptアプリにサンバーストグラフを追加 Vizuly Sunburst is designed to represent hierarchical data in a radial plot. It supports drill down and drill up capabilities by allowing the user to collapse and expand segments of the sunburst when they click on that area. ...
続きを読む
-
説明:
Add Scatter Plot charts to your JavaScript apps. Vizuly Scatter Plot shows 3 dimensions of data at once by plotting values along both the x and y axis as well as the radius of the plot itself. Each plot can be colored and styled dynamically based on your ...
続きを読む
この製品についてさらに結果を表示します。
-
説明:
JavaScriptアプリに散布図を追加 Vizuly Scatter Plot shows 3 dimensions of data at once by plotting values along both the x and y axis as well as the radius of the plot itself. Each plot can be colored and styled dynamically based on your data. Features Supports ...
続きを読む
-
説明:
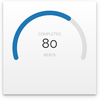
Show numeric values within a minimum and maximum range. Vizuly Radial Progress is designed to show numeric values within a minimum and maximum range. It can also show when a value has exceeded the maximum threshold. This chart supports a variable range of ...
続きを読む
この製品についてさらに結果を表示します。
-
説明:
決められた最小値と最大値の範囲内に数値を表示 Vizuly Radial Progress is designed to show numeric values within a minimum and maximum range. It can also show when a value has exceeded the maximum threshold. This chart supports a variable range of start/stop angles, arc end caps, ...
続きを読む
-
説明:
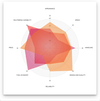
Add Radar charts to your JavaScript apps. Vizuly Radar Chart graphs multiple dimensions of one datum along multiple radial axis. Each plot represents 3 or more data points along shared axis lines. This chart supports highlighting of both individual data ...
続きを読む
この製品についてさらに結果を表示します。
-
説明:
JavaScriptアプリにレーダーグラフを追加 Vizuly Radar Chart graphs multiple dimensions of one datum along multiple radial axis. Each plot represents 3 or more data points along shared axis lines. This chart supports highlighting of both individual data points and the ...
続きを読む


