コンポーネント / Vizuly / O2 Solutions / MultiMedia Soft
Create highly customized and unique data visualizations.
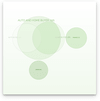
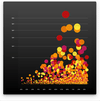
Scatter Plot Chart - Shows three dimensions of data at once by plotting values along both the X and Y axis as well as the radius of the plot itself. Each plot can be colored and styled dynamically based on your data.
Add PDF viewing functionality to your .NET applications.
- Includes Windows Forms PDF viewer control plus .NET library for rendering and printing PDF files from any .NET application
- Supports annotation, bookmarks, attachments and more
PDF enable your .NET applications.
- Create and edit PDF files and perform automated PDF form filling
- Unlimited pages per document, each with its own size and orientation
- Supports PDF annotations, layers and alpha transparency
-
説明:
PDF enable your Java applications. PDF4Java is a Java library for generating and importing PDF documents on the fly from any Java application. The library does not rely on any Adobe products for creating and importing PDF files. It hides the complex ...
続きを読む
-
リリースノート:
PDF4NET Text is not extracted correctly from PDF file. Some documents with optional content cannot be loaded. PDF4NET.Render Pages are not rendered correctly when using an intermediary render list. 0 ...
続きを読む
-
リリースノート:
PDF Rendering and PDF Viewer: Text using an invalid font is not rendered. Some LZW encoded images are not decoded correctly. PDF Viewer: Some PDF files are not saved correctly. Signed PDF files are not saved correctly. 0 ...
続きを読む
-
リリースノート:
PDF Rendering and PDF Viewer: Text using an invalid font is not rendered. Some LZW encoded images are not decoded correctly. Documents printed with the commercial version display 2 red dots. PDF Viewer: Some PDF files are not saved correctly. Signed PDF ...
続きを読む
-
説明:
Add charts and visualizations to your JavaScript apps. Vizuly Professional includes Corona, Halo, Radial Bar, Ring Chart, Weighted Tree, Geo Plot, Bar Chart, Column Chart, Line Area Chart, Radar Chart, Radial Progress, Scatter Plot, Sunburst, Tree Map, ...
続きを読む
-
説明:
Add Word Clouds to your JavaScript apps. Vizuly Word Cloud is a unique way to represent the occurrence rate of words within a given text stream. This visualization supports an exclusion list that will ignore common pronouns, profanity, or any words you ...
続きを読む
-
説明:
Add Venn Diagram charts to your JavaScript apps. Vizuly Venn Diagram shows all possible logical relations between a finite collection of different sets. This chart depicts elements as points in the plane, and sets as regions inside closed curves. A Venn ...
続きを読む
-
説明:
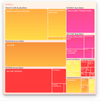
Add Tree Map charts to your JavaScript apps. Vizuly Tree Map visualizes hierarchical data in nested rectangular plots where the area of each rectangle is bound to a data property you can set. This TreeMap also supports the ability to drill down/up, in ...
続きを読む
-
説明:
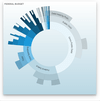
Adds Sunburst charts to your JavaScript apps. Vizuly Sunburst is designed to represent hierarchical data in a radial plot. It supports drill down and drill up capabilities by allowing the user to collapse and expand segments of the sunburst when they ...
続きを読む
-
説明:
Add Scatter Plot charts to your JavaScript apps. Vizuly Scatter Plot shows 3 dimensions of data at once by plotting values along both the x and y axis as well as the radius of the plot itself. Each plot can be colored and styled dynamically based on your ...
続きを読む


