公式サプライヤー
公式および認定ディストリビューターとして200社以上の開発元から正規ライセンスを直接ご提供いたします。
当社のすべてのブランドをご覧ください。

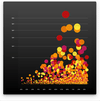
説明: Add Scatter Plot charts to your JavaScript apps. Vizuly Scatter Plot shows 3 dimensions of data at once by plotting values along both the x and y axis as well as the radius of the plot itself. Each plot can be colored and styled dynamically based on your ... 続きを読む この製品についてさらに結果を表示します。
説明: JavaScriptアプリに散布図を追加 Vizuly Scatter Plot shows 3 dimensions of data at once by plotting values along both the x and y axis as well as the radius of the plot itself. Each plot can be colored and styled dynamically based on your data. Features Supports ... 続きを読む

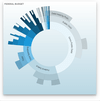
説明: Adds Sunburst charts to your JavaScript apps. Vizuly Sunburst is designed to represent hierarchical data in a radial plot. It supports drill down and drill up capabilities by allowing the user to collapse and expand segments of the sunburst when they ... 続きを読む この製品についてさらに結果を表示します。
説明: JavaScriptアプリにサンバーストグラフを追加 Vizuly Sunburst is designed to represent hierarchical data in a radial plot. It supports drill down and drill up capabilities by allowing the user to collapse and expand segments of the sunburst when they click on that area. ... 続きを読む

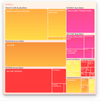
説明: Add Tree Map charts to your JavaScript apps. Vizuly Tree Map visualizes hierarchical data in nested rectangular plots where the area of each rectangle is bound to a data property you can set. This TreeMap also supports the ability to drill down/up, in ... 続きを読む この製品についてさらに結果を表示します。
説明: JavaScriptアプリにツリーマップを追加 Vizuly Tree Map visualizes hierarchical data in nested rectangular plots where the area of each rectangle is bound to a data property you can set. This TreeMap also supports the ability to drill down/up, in addition to a navigation ... 続きを読む

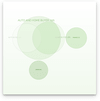
説明: Add Venn Diagram charts to your JavaScript apps. Vizuly Venn Diagram shows all possible logical relations between a finite collection of different sets. This chart depicts elements as points in the plane, and sets as regions inside closed curves. A Venn ... 続きを読む この製品についてさらに結果を表示します。
説明: JavaScriptアプリにベン図を追加 Vizuly Venn Diagram shows all possible logical relations between a finite collection of different sets. This chart depicts elements as points in the plane, and sets as regions inside closed curves. A Venn diagram consists of multiple ... 続きを読む

説明: Add charts and visualizations to your JavaScript apps. Vizuly Professional includes Corona, Halo, Radial Bar, Ring Chart, Weighted Tree, Geo Plot, Bar Chart, Column Chart, Line Area Chart, Radar Chart, Radial Progress, Scatter Plot, Sunburst, Tree Map, ... 続きを読む この製品についてさらに結果を表示します。
説明: JavaScriptアプリに多種多様なグラフを追加 Vizuly Professional includes Corona, Halo, Radial Bar, Ring Chart, Weighted Tree, Geo Plot, Bar Chart, Column Chart, Line Area Chart, Radar Chart, Radial Progress, Scatter Plot, Sunburst, Tree Map, Venn Diagram and Word Cloud. It ... 続きを読む

説明: Create modern and responsive line-of-business desktop apps that run on every Windows device. DevExpress WinUI ships with 20 controls (including a DataGrid, Scheduler, Ribbon UI, Data Editors, Reporting, Gauge Indicators, Range Control, and over 10 Chart ... 続きを読む この製品についてさらに結果を表示します。
説明: すべてのWindowsデバイスで実行可能なモダンで応答性の高い基幹業務デスクトップアプリを作成 DevExpress WinUI ships with 20 controls (including a DataGrid, Scheduler, Ribbon UI, Data Editors, Reporting, Gauge Indicators, Range Control, and over 10 Chart types). WinUI Data Grid Always fast, always ... 続きを読む

説明: Multi-platform app library with high-performance UI components for Android and iOS mobile development. DevExpress.NET MAUI includes a Data Grid, Chart, Scheduler, Data Editors, CollectionView, and Tabs components. The.NET MAUI components are written in ... 続きを読む この製品についてさらに結果を表示します。
説明: AndroidおよびiOSモバイル開発用の高性能UIコンポーネントを備えたマルチプラットフォームアプリライブラリ DevExpress.NET MAUI includes a Data Grid, Chart, Scheduler, Data Editors, CollectionView, and Tabs components. The.NET MAUI components are written in Objective-C (iOS) and Java/Kotlin (Android). All ... 続きを読む

説明: A feature-rich grid control for Silverlight. AgDataGrid Suite was developed to fully exploit the power and flexibility of Silverlight. AgDataGrid Suite includes a Silverlight Grid Control accompanied by data editors that can be used standalone or for in ... 続きを読む この製品についてさらに結果を表示します。
説明: Silverlight用の機能満載のグリッドコントロール AgDataGrid Suiteには、データ エディターを搭載されたSilverlight Grid Controlが含まれます。このデータエディターは、単独またはインプレースのセル編集にも使えます。AgDataGrid Suite が提供する拡張機能として、Microsoft Excel風 のデータ フィルタリングが含まれ、エンドユーザーによる列の移動やサイズの変更も可能です。また、データのグループ化やソート ... 続きを読む

説明: Add gauges and digital dashboards to your ASP.NET applications. ASPxGauges Suite lets you place multiple gauges into one container and enable automatic arrangement. ASPxGauges Suite allows you to place multiple DevExpress Gauges into one container and ... 続きを読む この製品についてさらに結果を表示します。
説明: ASP.NETアプリケーションにゲージやデジタルダッシュボードを加えることができます。 ASPxGauges Suite で、複数のDevExpress Gaugesを一つのコンテナに配置し、自動的に整理することが可能になります。ASPxGauges Suite (GaugeControl) には、状態表示ゲージ、 円形ゲージ、線形ゲージおよびデジタル ゲージが含まれます。なお、当スイートに含まれるすべてのゲージはベクトルグラフィックで作成されているため、自由にサイズの変更をしても ... 続きを読む

説明: Add Outlook style grids to your ASP.NET applications. With patent-pending server side data processing, the high performance DevExpress ASP.NET Data Grid is a powerful editing and data shaping component allowing end-users to easily manage information and ... 続きを読む この製品についてさらに結果を表示します。
説明: Outlook スタイルのグリッドを ASP.NET アプリケーションに追加できます。 Developer Expressが提供するASPxGridView and Editors Suiteは、100% C#をベースとするASP.NET用グリッド コントロールです。データ ナビゲーターなどが内蔵されたASPxGridViewは、Outlookスタイルのグループ化機能(複数列のソートやデータ サマリー機能)に対応しています。ASPxGridView and Editors Suiteは、ASP ... 続きを読む